Series 21, Episode 9: Professor Sleepy and Doctor Gong
Your Task
Provide your own commentary to the following tables and figures.
The following tables and figures are related to Episode 9 of UK Taskmaster Series 21, and generated using the raw data found in the following Google Sheets File
Most entertaining and insightful commentary wins the task!
Episode Recap
Episode 9 Performance Report Card
Episode 9 Performance Grade is based on comparing the current episode performance, to the prior 8 episode(s) performance and where it lies in the distribution.
Figure 1: Episode 9 Performance Report Cards
What a close episode that was!
And what, ANOTHER episode featuring a tie? Does the series have the most episodes with ties?
Figure 2: Yet another episode featuring a tie?!

Series Scoreboard Tracker
Figure 3: Series Scoreboard Tracker
Even Armando is candidate for the championship! Who would have thought this at the beginning of the series!
Neighbourhood Watch
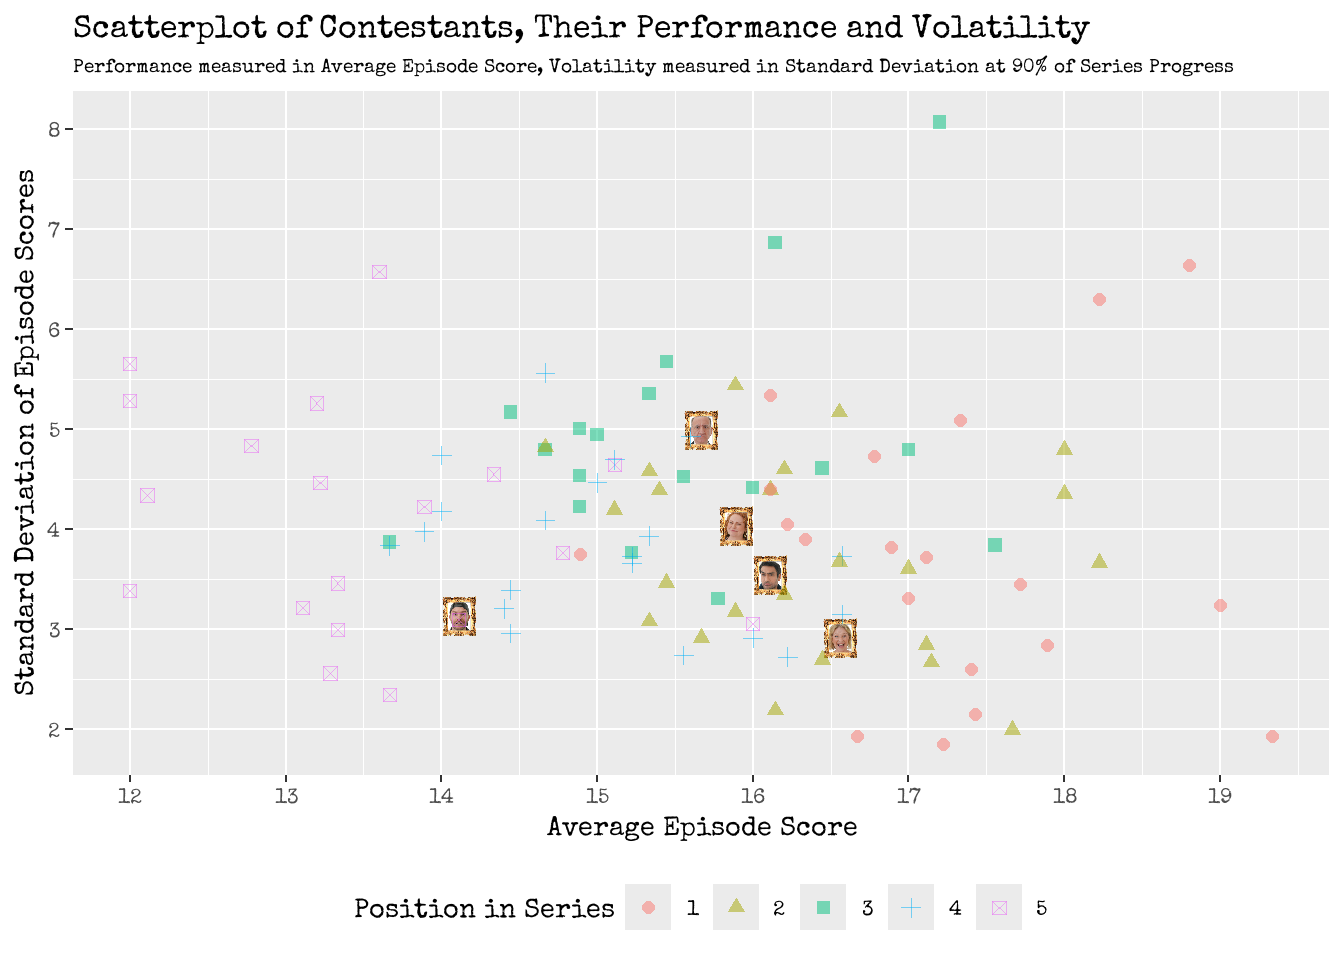
Figure 4: Left: Scatter! A graphical visualisation of Contestants Episode Performance and their Volatility.
Right: The similar neighbours of the cast of Series 21.
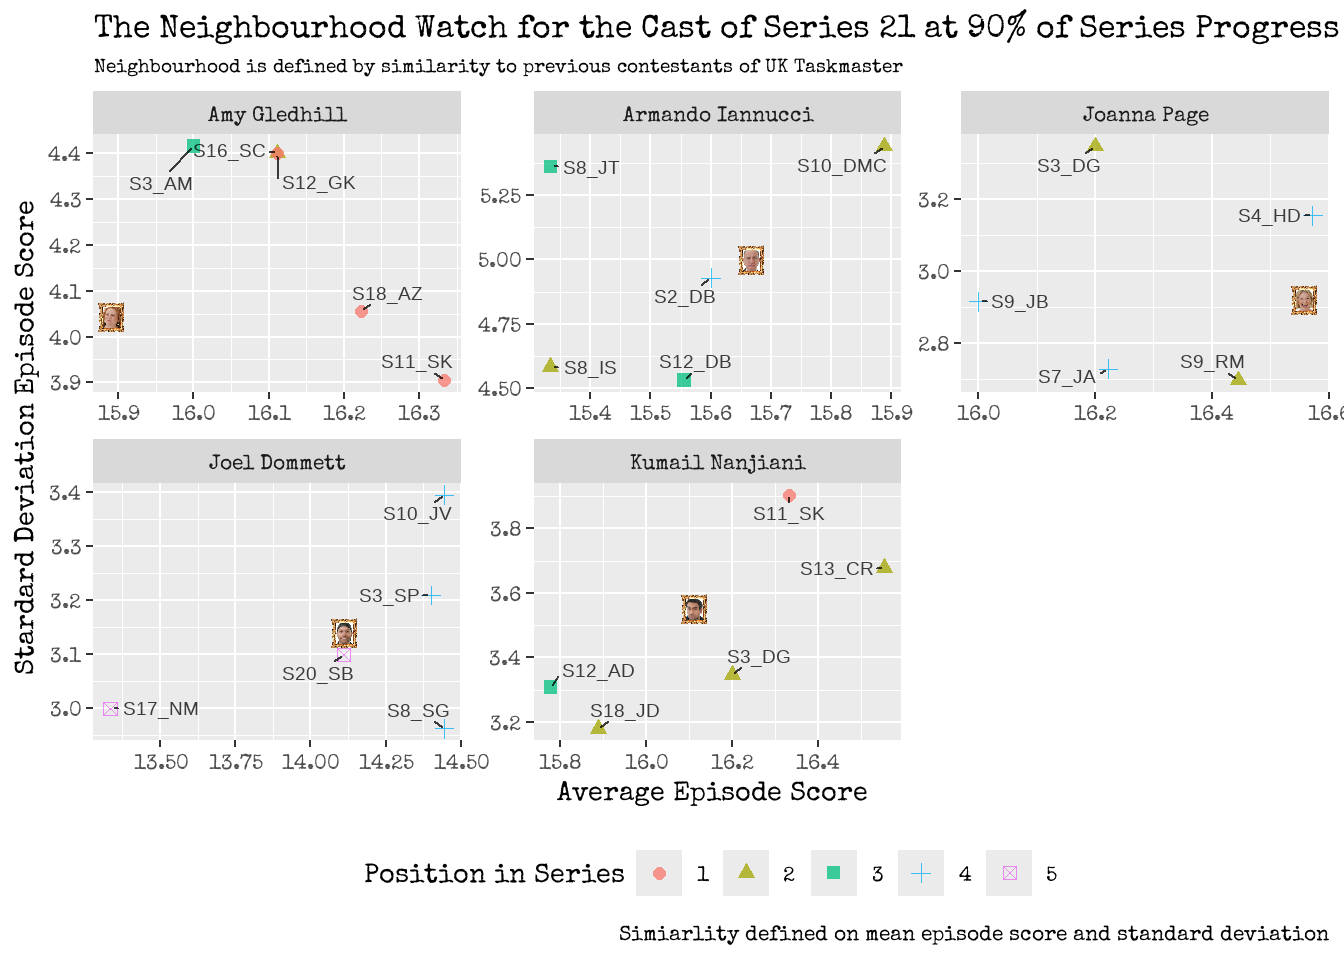
A clear separation between Joel and the rest of the Series 21 cast. It’s like he’s stuck down a well, having a WELL good time.
Gamble’s Gamble
End-of-Series Ranking Distributions
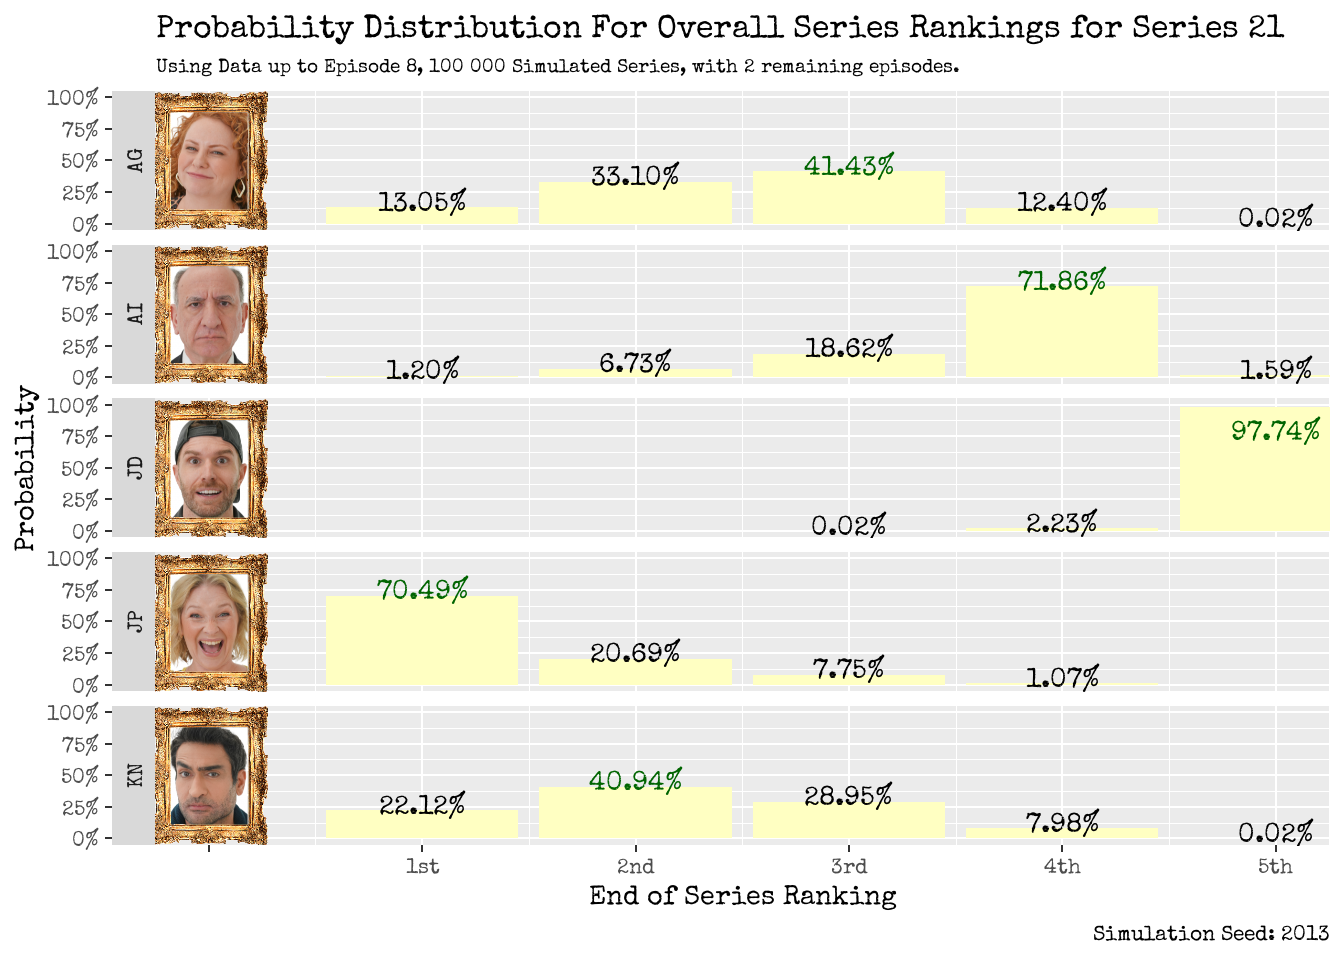
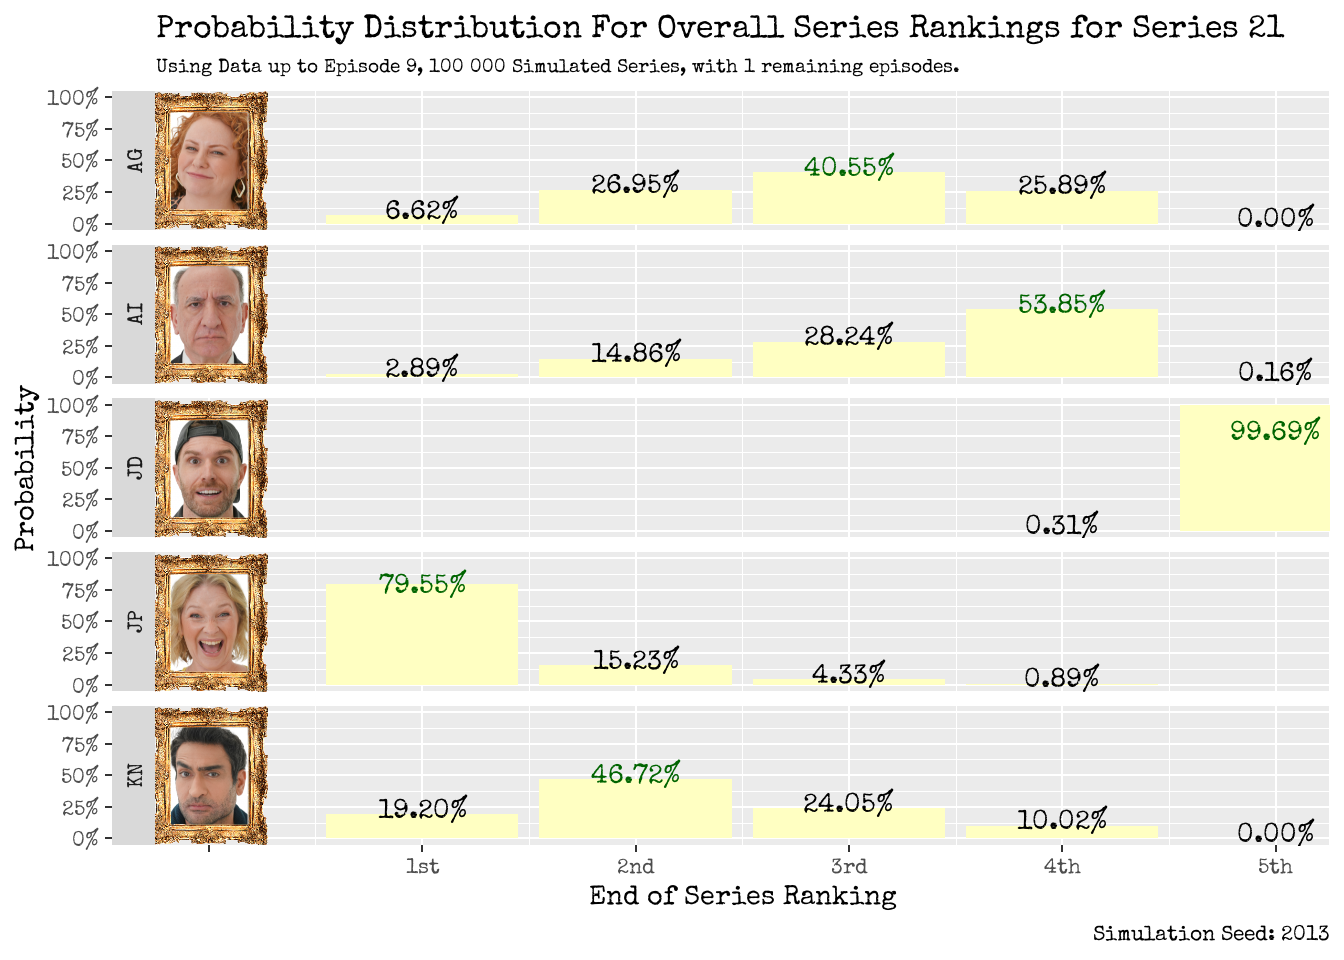
Figure 5: Series Ranking Distribution: Using Data up to Episode 8 (left), and up to Episode 9 (right).
When vibes and feelings outperform science and logic.
The Ever Changing Series Distributions
Figure 6: Animation and evolution of the series ranking distributions as the series progresses.
The effects of eating eleven Curly Wurlys a day for a year.
Joint Cast Ranking Distributions
Figure 7: Joint Distribution of Cast Series Ranking: Using Data up to Episode 8 (left), and up to Episode 9 (right).
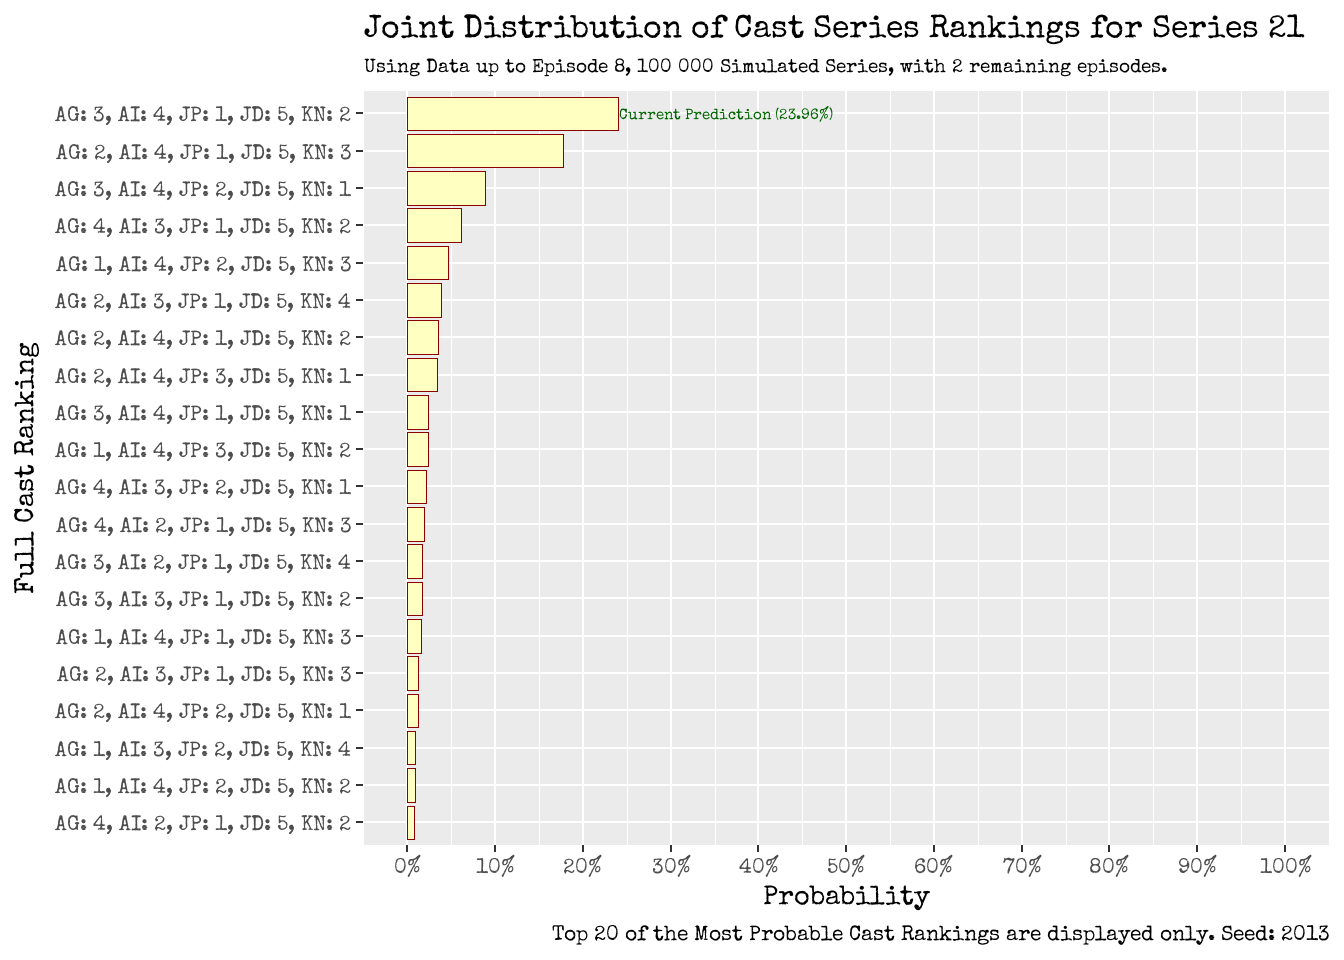
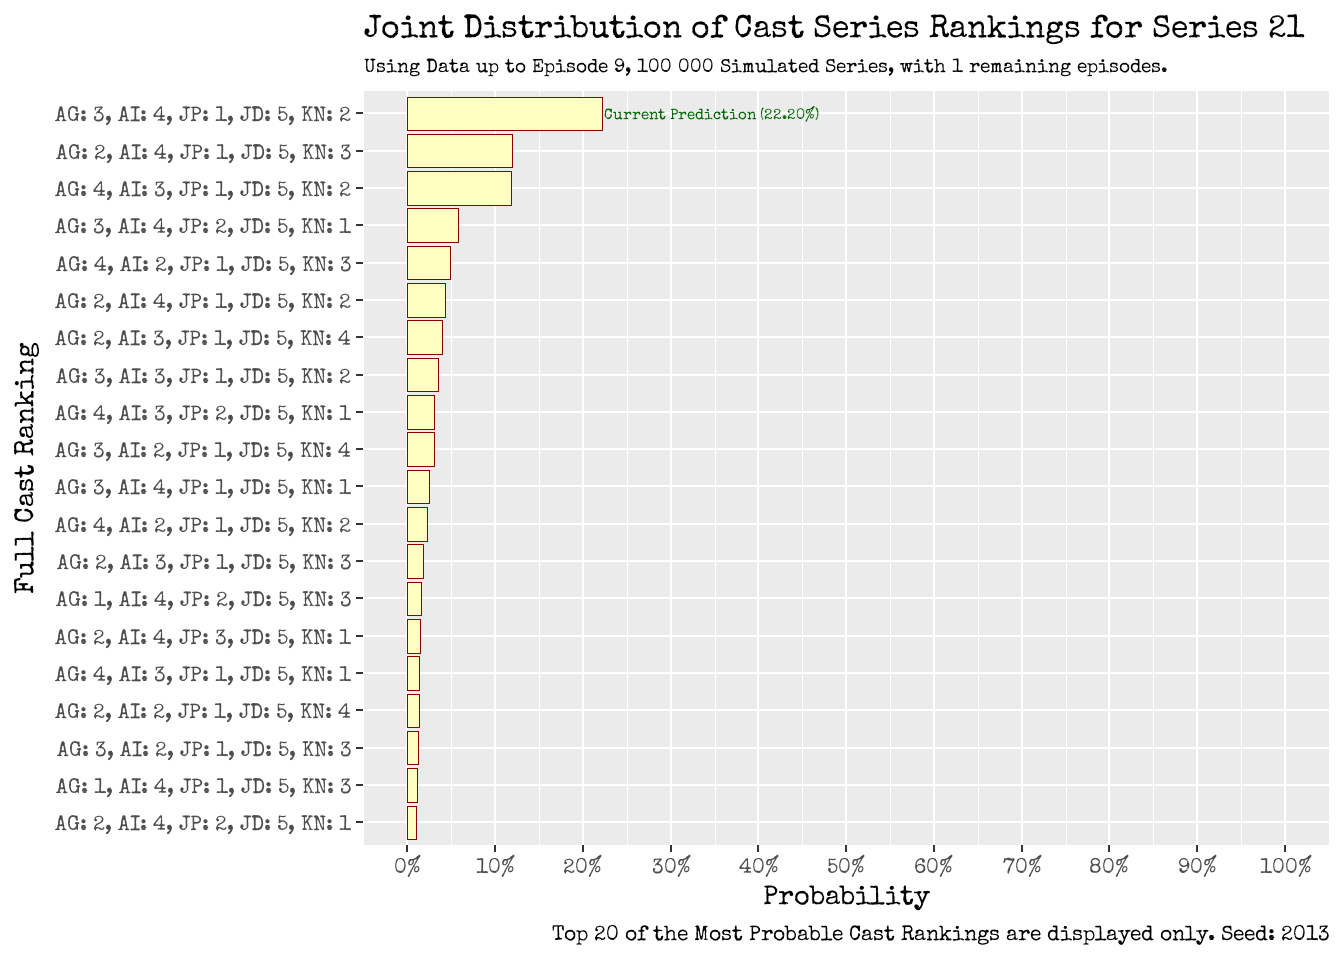
Imagine the 25 minute long speech Joanna will potentially give if she is crowned champion of the series!
What Have We Learnt Today?
We’ve learnt that:
- One way to provide these posts on time is to make the reader work and think for themselves by NOT providing additional written commentary.
- It is also way to relieve the author of The Median Duck from some pressure.
- But I also couldn’t resist adding in some snarky comments and the occasional gif.
Figure 8: Come on boy! Walkies!
