Series 21, Episode 2: CAGED BAGGAGE with a HEAD full of CABBAGE
My head is full of cabbage and I’m currently suffering a case of statistical writer’s block1. Or at least that’s my excuse for missing my own deadline (internally set to be before the broadcast of the next episode).
As punishment for my tardiness, I have not watched Episode 3 of Series 21 yet.
Figure 1: Kumail representing my current state of mind.

Your Task
Get your leg up Johnny! Time to provide some (statistical) commentary of Episode 2 of
SeasonSeries 21 of Taskmaster.The raw data (each contestants task attempt) for Series 21 can be found in the following Google Sheets File.
Figure 2: Let’s get this sham of a blog post on the road!

Episode Recap
Episode 2 Performance Report Card
Episode 2 Performance Grade is based on comparing the current episode performance, to the prior 1 episode(s) performance and where it lies in the distribution.
Figure 3: Episode 2 Performance Report Cards
Series 21 Task Points Distribution.
Past covers tasks up to Episode 1, Current Ep covers tasks in Episode 2.
Figure 4: Episode 1 Task Distributions
At the end of Episode 2 and as deduced from the Performance Report Card (Figure 3) and Task Points Distribution (Figure 4):
- The women continue to be the major contenders for Series 21.&
- Amy won the episode with 20 points, with Joanna following not too far behind with 19 points.
- The men round out the bottom half of this episode race with only 2 points separating them (15 for Armando, 13 for Joel and Kumail).
- All contestants, except for Joanna, saw an improvement on their Episode 1 performance.
- This is no doubt due to the lack of “winner takes all” tasks and levelling out the playing field.
- Kumail was finally awarded 5 points for a task! And this was for a task that he thought he performed badly at; he took the longest physical time but was penalised the least. Such is the Taskmaster way!
- He was also awarded 4 points for the first time in the episode so far. Could Kumail be on an upward streak?
- All the men of Series 21 have tasks been awarded points from 0 to 5 at least once (henceforth known as a full house?). In contrast, Amy has yet to be awarded 1 point for a task, and Joanna has yet to be awarded any points below 2 points.
- This likely explains why the women are dominating the series at the moment, in particular, Joanna.
Figure 5: Kumail’s surprise to winning a task.

The (Sad) Story of BAGFACE
The live task was clearly inspired by a Horne Section song, “BAGFACE”.
In this song, certain words are spelt out using the letters of the musical alphabet (ABCDEFG), and played accordingly. This leads to an amusing (and dark) story featuring a BEE called BAGFACE.
This song, and the concept of spelling words out through music, has made such an important impact on my life that I frequently use it as a piano teaching aid (what word am I spelling out on the keys of the piano). If I had any morals or principles, I would give a cut of my teaching income to The Horne Section.
I had a go at playing this game myself (using a piano to match the bagpipe notes), and it is quite difficult, largely due to the tuning on a bagpipe being different to that of a standard piano. (some background) Alex does mention in a quick side comment that the glockenspiels have been tuned specifically to the bagpipes.
Figure 6: Leg Up Johnny!

The Taskmaster UK Universe (TM-UK-U)
We’ve previously only considered and compared a contestants performance to within their own series. As someone who is always wanting to improve and grow, it is now time to consider comparing contestants from all of UK Taskmaster history, not just within their series.
What Do You Mean?
How do the cast of Series 21 compare to the contestants that have come before them in terms of average episode score?
Figure 7 show boxplots of the average episode score for all prior contestants, grouped by how they placed at the end of series. At the bottom of the plot are the current average episode scores for the cast of Series 21.
To allow for valid comparisons, we compare the average episode scores to a comparable point in prior series. That is, as we are 20% into Series 21 (2 episodes have aired of a 10 episode series), we compare to 20% (or nearest available) of prior series. This will still be Episode 2 for Series 6 onwards as they had 10 episodes per series. For prior series which had less than 10 episodes), this will be a different episode. For example for Series 1 which had 6 episodes, the comparable episode would be Episode 1, and for Series 4 and 5 (which both comprised of 8 episodes), the comparable episode point would be Episode 2.
Figure 7: Average Episode Score Comparison to all Taskmaster UK Contestants.
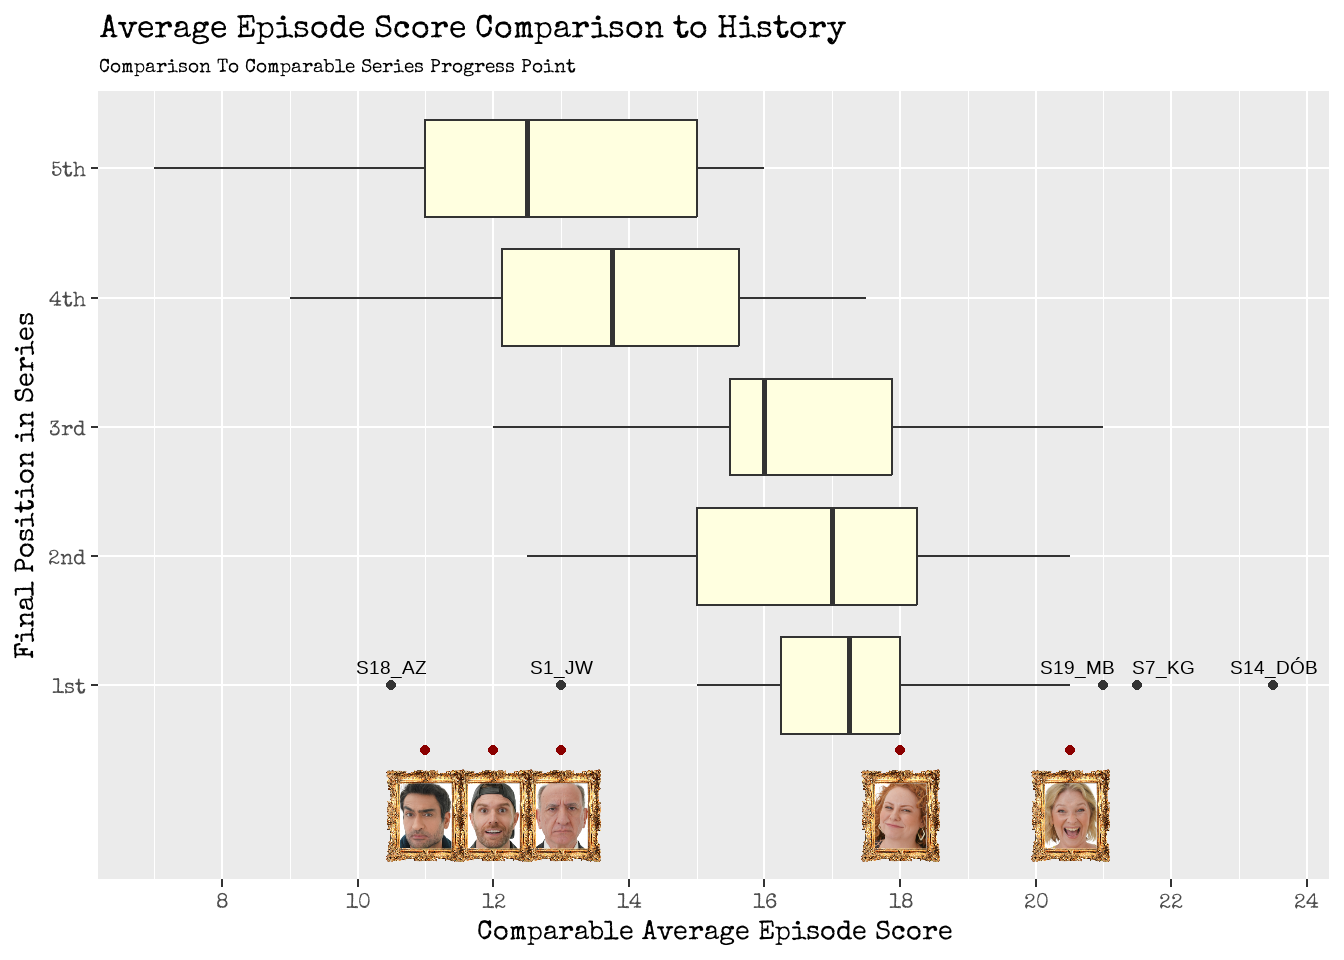
From Figure 7, we see that:
- Joanna currently has an average episode score which lies on the upper tails of the distributions for those who placed 1st, 2nd and 3rd in the series.
- Only Series 19’s Matthew Baynton, Series 7’s Kerry Godliman and Series 14’s Dara Ó Briain have achieved average episode scores which are higher than Joanna’s.
- Amy also has average episode score which lies in the upper interquartile range of the 1st, 2nd and 3rd distributions.
- There is still some hope for Kumail, Joel and Armando winning the series! They should look to Series 1’s Josh Widdicombe and Series 18’s Andy Zaltzman as role models; these two contestants had poor starts in their respective series (low average episode scores), before turning their luck and winning their series.
- There is a noticeable gap between the average episode scores of the girls and the boys. Who knows if this gap will remain (and potentially remain the same size), as the series continues.
Some general observations:
- The boxplot associated with 1st place is tightest (smallest interquartile range), although outliers have been identified which lie beyond the whiskers.
- It is also fair to say that the spread of the boxplots (the whiskers, not the outliers) increases as we progress down the series ranking.
- It’s also interesting to see that whilst there is a potentially positive correlation between interquartile range and series position (interquartile range size increases as series position increases), the range of placing 3rd is smaller tha placing 2nd.
- Not all boxplots are symmetrical, indicating a skewed distribution. This is most promininent for the boxplots associated with 3rd and 5th place.
Figure 8: Greg commenting on my writing and analysis

Scatter!
The average episode score point is a good starting point, but what about a contestant’s volatility and variation in performance? Can we consider this in our comparisons between contestants?
Figure 9 provides a graphical visualisation of contestants episode performance and their volatility. This visualisation is in the form of a scatter plot where each point represents a contestant from the Taskmaster annals where:
- the x-axis (horizontal direction), represents the average episode score of that contestant.
- the y-axis (vertical direction), represents the standard deviation of episode score for that contestan_t.
For both of these statistics, we consider the same comparable point in prior series (20% for Episode 2 of Series 21), to allow for valid comparisons.
An observation point in the following quadrants can be interpreted as follows:
- Top-Right: High average and high volatility. Contestant scores highly on average, but also shows a great deal of variation in their scores and performance.
- They are high performing, but inconsistent contestant. They perform well in general, but have occasional moments of failure and stupidity.
- Bottom-Right: High average and low volatility. Contestant scores highly on average, and shows little variation.
- They are high performing and consistent contestant.
- Bottom-Left: Low average and low volatility. Contestant scores lowly on average, and shows little variation.
- They are low performing but consistent contestant.
- Top-Left: Low average and high volatility. Contestant scores lowly on average, but also exhibits a great deal of variation and uncertainty in their score and performance.
- They are low performing, but inconsistent contestant. They perform badly in general, but have occasionally moments of brilliance and success.
The colour and point type of the observation denotes the eventual series position for the contestant. Labels for each point have also been added denoting the Series and the Initials of the contestant. For example “S10_KP” denotes Series 10’s Katherine Parkinson.
The average performance and volatility of Series 21 contestants have also been denoted as their image in order to aid the comparisons, although these comparisons will be more clearer in Figure 11.
Figure 9: Scatter! A graphical visualisation of Contestants Episode Performance and their Volatility.
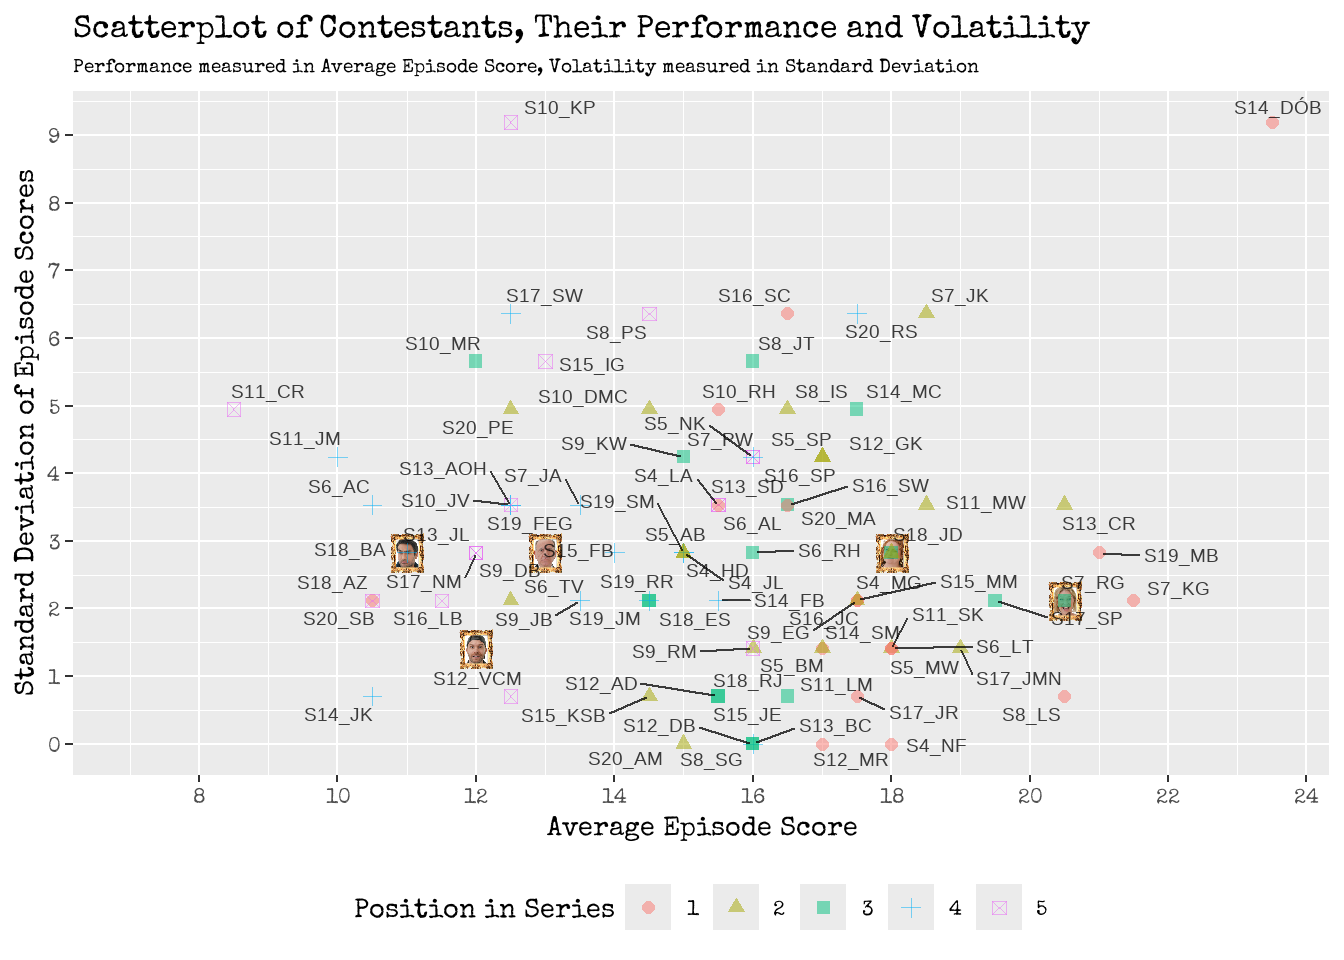
From Figure 9, and 20% into a series:
- The Series 21 contestants are camouflaged in the performances of prior Taskmaster contestants.
- Their performance and volatility are not abnormal compared to prior series and contestants of UK Taskmaster.
- Series 10’s Katherine Parkinson and Series 14’s Dara Ó Briain are the two most volatile contestants at this point in a series’ lifecycle.
- However, Katherine has a lower performance ability (6 and 19 points in Episode 1 and 2, placing 5th and 1st respectively), whilst Dara has a higher performance ability (17 and 30 points in Episode 1 and 2, placing 2nd and 1st respectively).
- Dara scoring an abnormally high 30 points for a single episode is due to 4 pre-recorded tasks being featured in the episode (rather than standard 3) and bonus points being awarded in the “Sort the ducks and the socks” task. Dara also scored the maximum number of points in all tasks.
- Whilst Dara has the highest average episode score at this point, Series 11’s Charlotte Ritchie has the lowest average episode score. She is by no means in the Top 10 of most volatile contestants at this point in time.
Figure 10: Joel continuing with the barrage of abuse concerning my side project.

Won’t You Be My Neighbour?
Figure 11 displays the same information as in Figure 9; we have simply honed into each of the Series 21 contestants, and displayed only the top 5 nearest observations. These observations, and the associated contestants, are considered the most similar to the Series 21 contestant (with respect to average performance and volatility), and thus define their neighbourhood.
Figure 11: Won’t you be my Neighbour? Who are the neighbours of the cast of Series 21? Neighbours are based on a similarity measure based on average episode score and volatility.
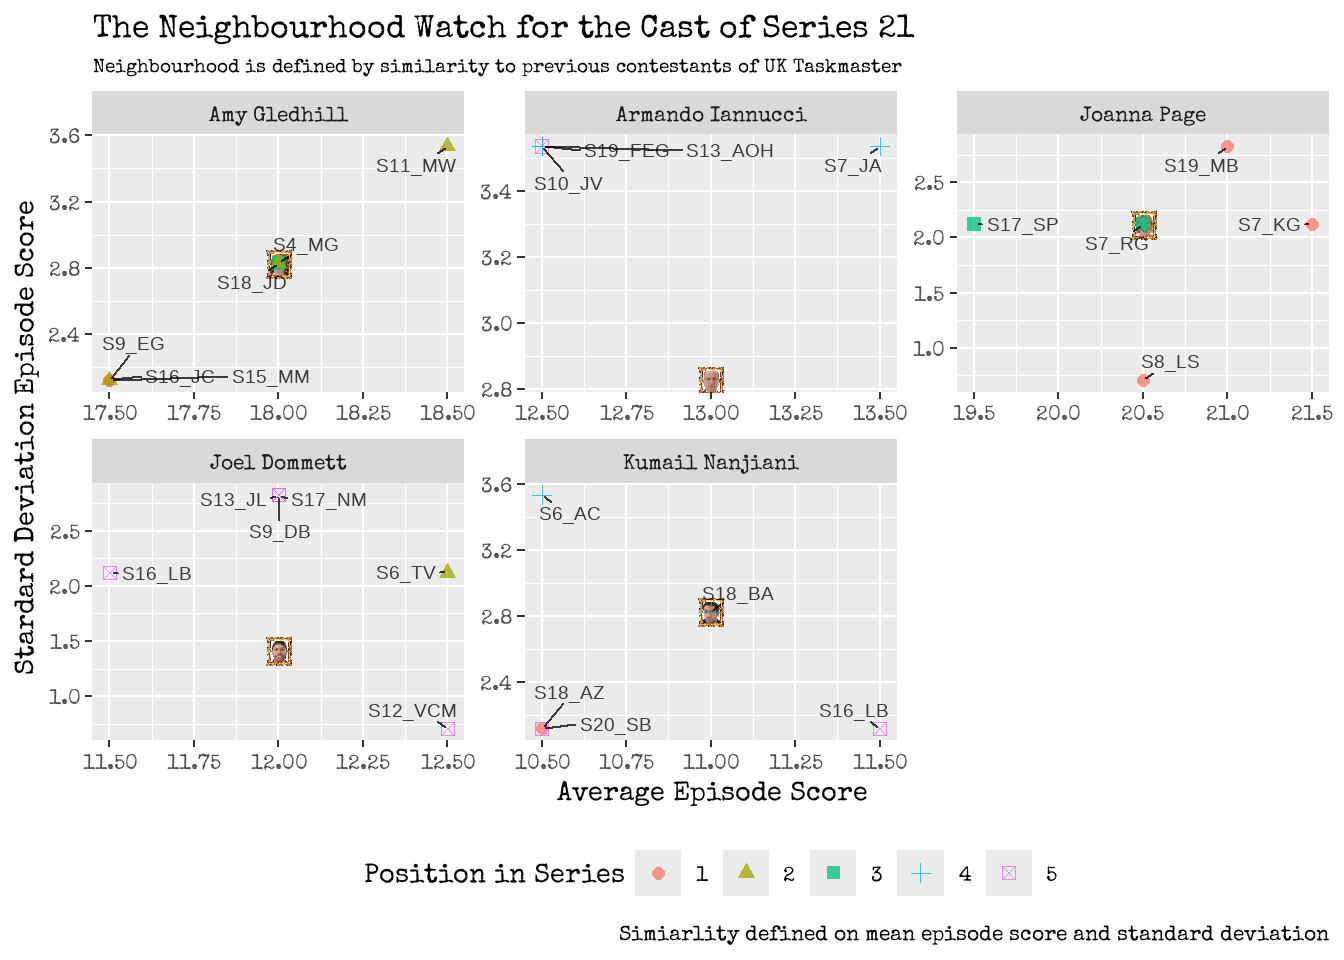
As seen in Figure 11, and at 20% into a series we see that:
- Amy has exactly the same average episode performance and volatility as Series 4’s Mel Giedroyc and Series 18’s Jack Dee. We could say that they reside in the same household. Both of these contestants placed 3rd and 2nd in their series.
- Series 11’s Mike Wozniak (2nd), Series 9’s Ed Gamble (1st), Series 16’s Julian Clary (2nd) and Series 15’s Mae Martin (1st) also inhabit Amy’s neighbourhood. 2 of these neighbours eventually placing 1st in their series may provide some reassurance to the Series 21 cavewoman.
- Armando does not share his household with anyone at the moment. He does not share the same average of standard deviation as previous contestants.
- His neighbours do include Series 10’s Johnny Vegas (4th), Series 19’s Fatiha El-Ghorri (5th), Series 13’s Ardal O’Hanlon (4th) and Series 7’s James Acaster (4th). Based on these neighbours, we could predict that Armando is likely to come at bottom end of the Series 21 leaderboard.
- Joanna shares a household with Series 7’s Rhod Gilbert; the Welsh stick together in average episode performance and volatility evidently! Rhod finished 3rd in his series, which may come as a shock to Joanna’s ambitions.
- Also in the vicinity are Series 17’s Sue Perkins (3rd), Series 8’s Lou Sanders (1st), Series 19’s Mathew Baynton (1st) and Series 7’s Kerry Godliman (1st). 3 out of the 5 neighbours placing 1st may restore some hope to Joanna.
- Joel lives alone in his household as he does not share the same average episode score or standard deviation.
- His neighbours do not provide a great hope that he will rank highly in the series. His neighbours consist of Series 16’s Lucy Beaumont, Series 13’s Judi Love, Series 17’s Nick Mohammed, Series 9’s David Baddiel, Series 7’s Tim Vine and Series 12’s Victoria Coren Mitchell. All but Tim Vine placed 5th in their respective series eventually; Tim place 2nd in Series 6.
- Kumail shares a house with Series 18’s Babatunde Aléshé in our statistically defined world. Babatunde only placed 4th in his series, which seems like an attainable goal for Kumail.
- Other residents of Kumail’s neighbourhood include Series 6’s Asim Chaudhry (4th), Series 18’s Andy Zaltzman (1st), Series 20’s Sanjeev Bhaskar (5th) and Series 16’s Lucy Beaumont (5th). Andy’s presence in the neighbourhood provides some hope that Kumail may just need some time to warm up in this race before he storms to victory in the series.
It is somewhat interesting to see that there is only one neighbour from a less than 10 episode series (Mel Giedroyc from Series 4; Series 6 onwards is when 10 episode length serieses started), this may change however as the series progresses. It is worth noting that for Series 1 to 3, the comparable series progress is only Episode 1, and thus a standard deviation cannot be computed from single observation.
Figure 12: Thank god no one shares a house with Armando in our fictional household and neighbourhoods.
Series Scoreboard Tracker
Figure 13: Series Scoreboard Tracker
From Figure 13, which tracks the series progress at the end of each episode, we see that Joanna still remains the leader of this series. Her win in Episode 1, and the contestant only being awarded points in Episode 1’s live task, has definitely provided her a comfortable lead into the series.
Amy still remains in second place, but has managed to close the gap on Joanna’s series lead (reduced from 6 to 5 points following Episode 1). This can be attributed to Amy’s win in Episode 2, and no “winner takes all” tasks featuring in Episode 2.
Girl Power is currently active in Series 21 with a 10 point gap between Amy and Armando, the latter of which is in 3rd place and the leader of the men. However, there are only 4 points between all the men, with Joel hot on the heels of Armando, and Kumail on the heels of Joel.
The placement of the men could well change by next episode; a difference of 4 points is beatable and Kumail is potentially on a improvement streak.
Figure 14: A feathery metaphor for how the Series 21 is progressing along.

What are the odds?
Within-Episode Ranking Distributions
Figure 15: Within Episode Ranking Distribution: Using Data up to Episode 1 (left) and up to Episode 2 (right).
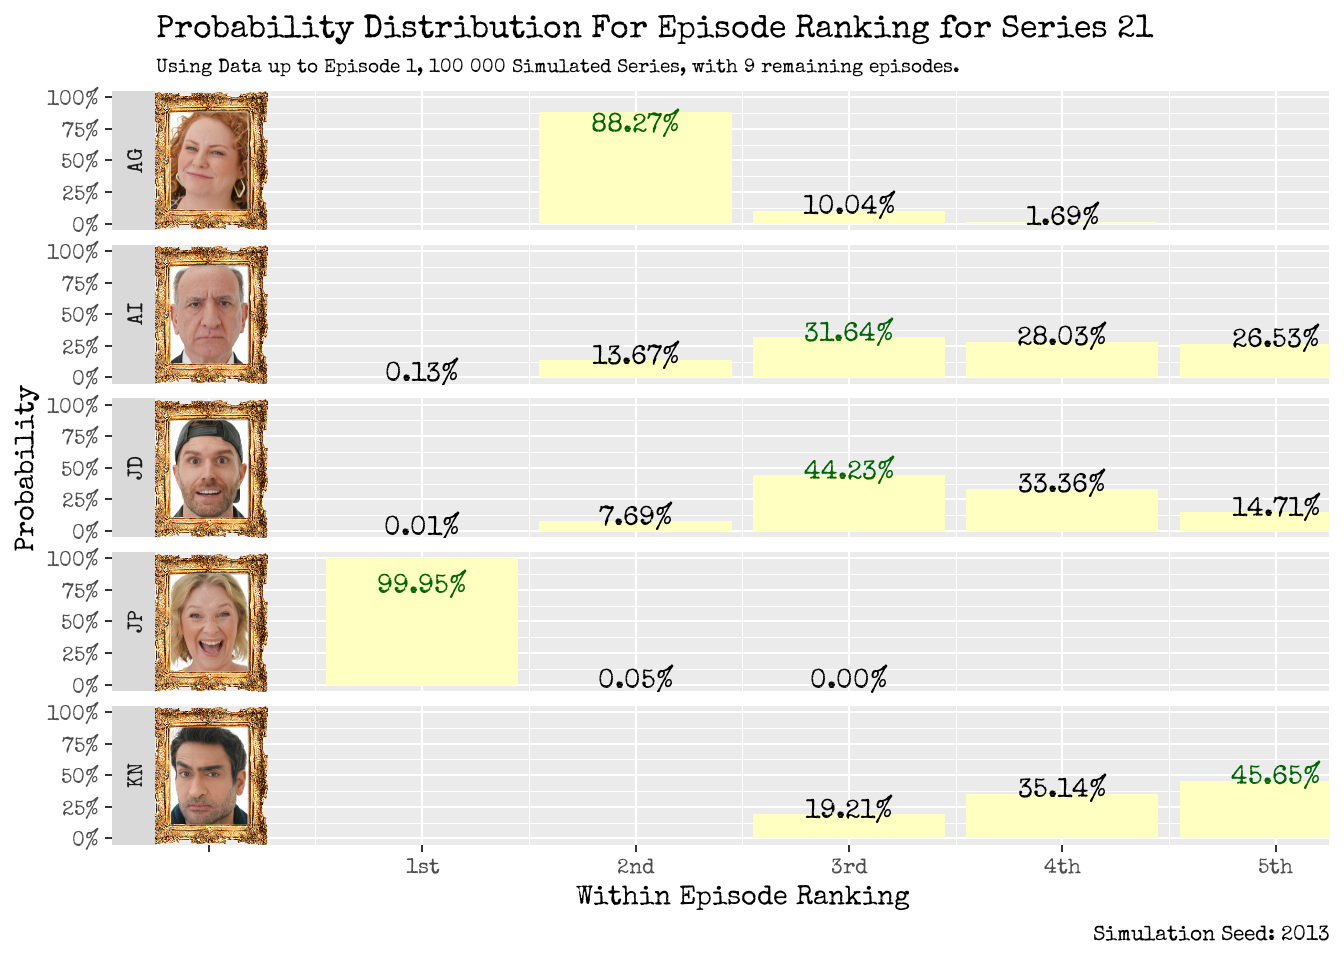
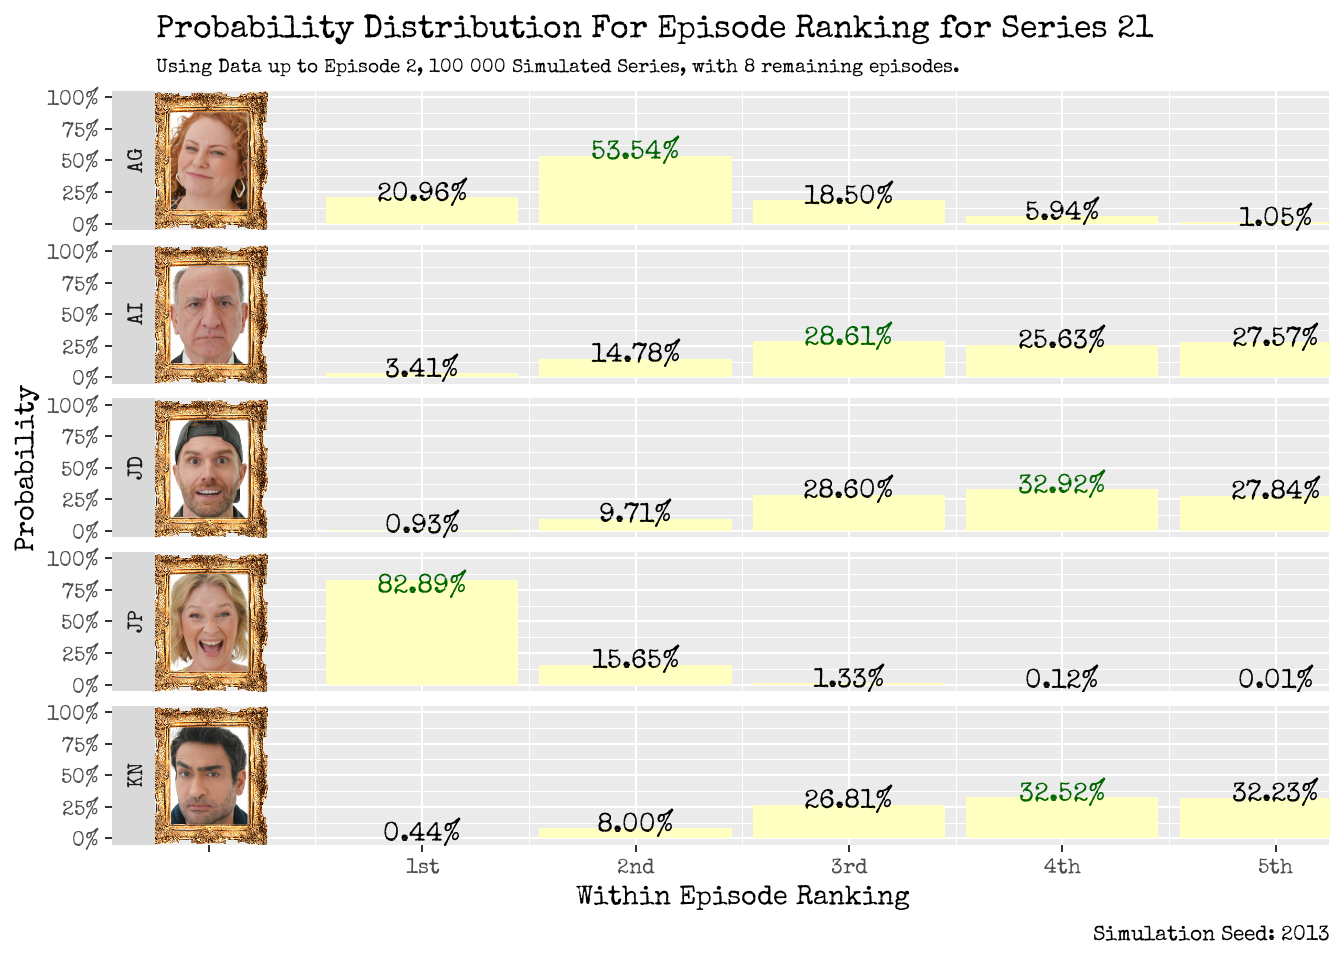
From Figure 15:
- Each contestant’s distributions have retained the same shape, but are noticeably flatter and less peaky due to the outcome of Episode 2. Most noticeably:
- Amy peak on coming 2nd in an episode has become less prominent, and the associated probability has shifted to coming 1st. This is evidently a reflection of her winning the 2nd episode. We also see an increase in probability on her coming 3rd, 4th and 5th in an episode, a result of Amy having a few below average tasks in her mix.
- Joanna is still the favourite to win an episode, but we are less certain about this. This is not surprising given that she didn’t win Episode 2.
- Most probable outcome with regards to within episode placement:
- Amy: 2nd with 53.54% chance (previously 2nd with 88.27%).
- Armando: 3rd with 28.61% probability (previously 3rd with 31.64%).
- Joel: 4th with 32.92% chance (previously 3rd with 44.23%).
- Joanna: 1st with 82.89% probability (previously 1st with 99.95%).
- Kumail: 4th with 32.52% chance (previously 5th with 45.65%).
Figure 16: Joel sniggering that his chances of winning an episode have decreased.

End-of-Series Ranking Distributions
Figure 17: Series Ranking Distribution: Using Data up to Episode 1 (left), and up to Episode 2 (right).
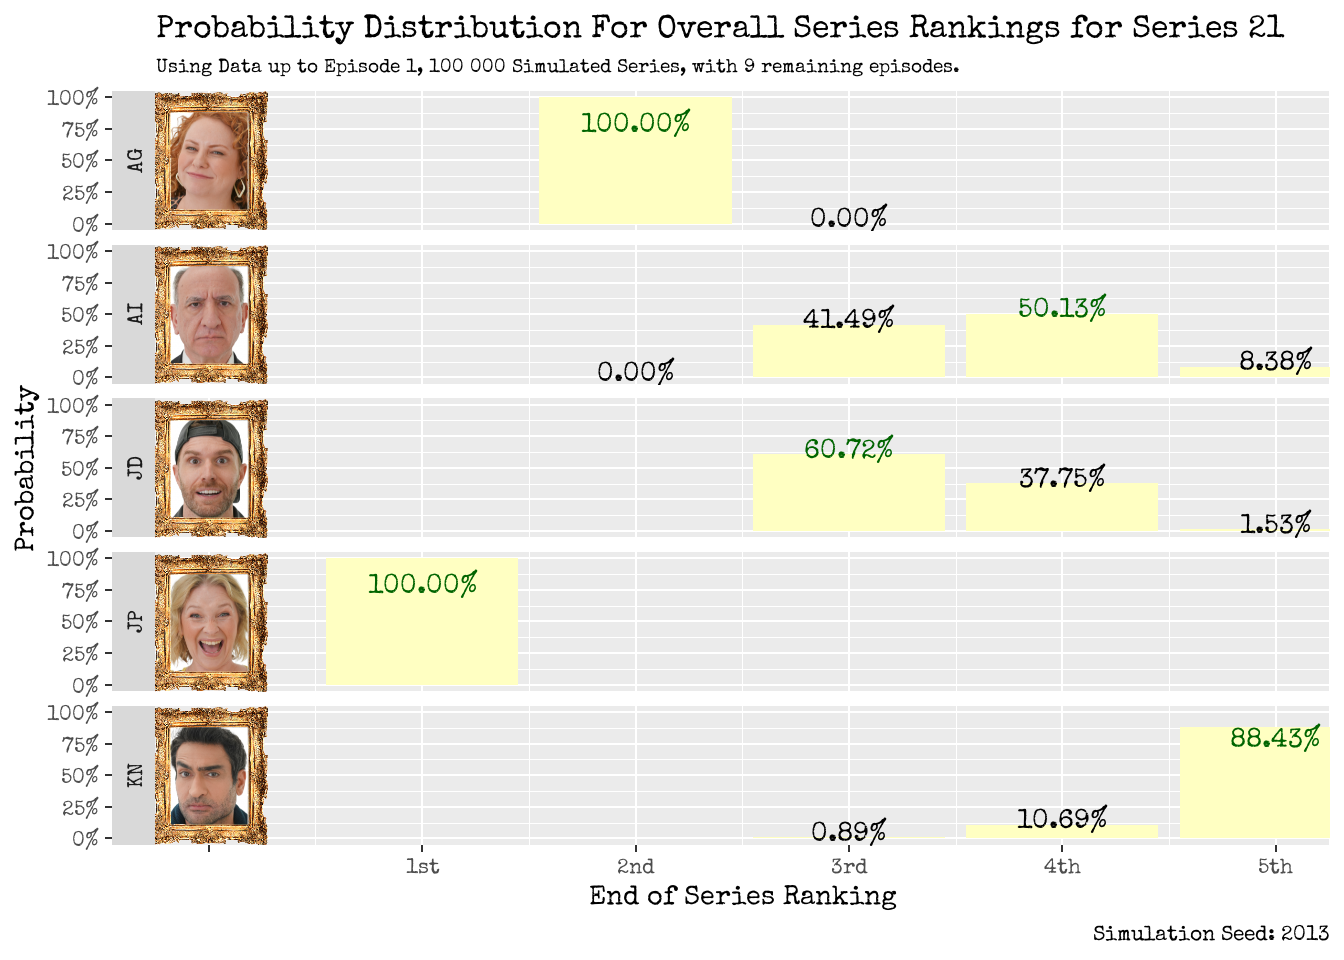
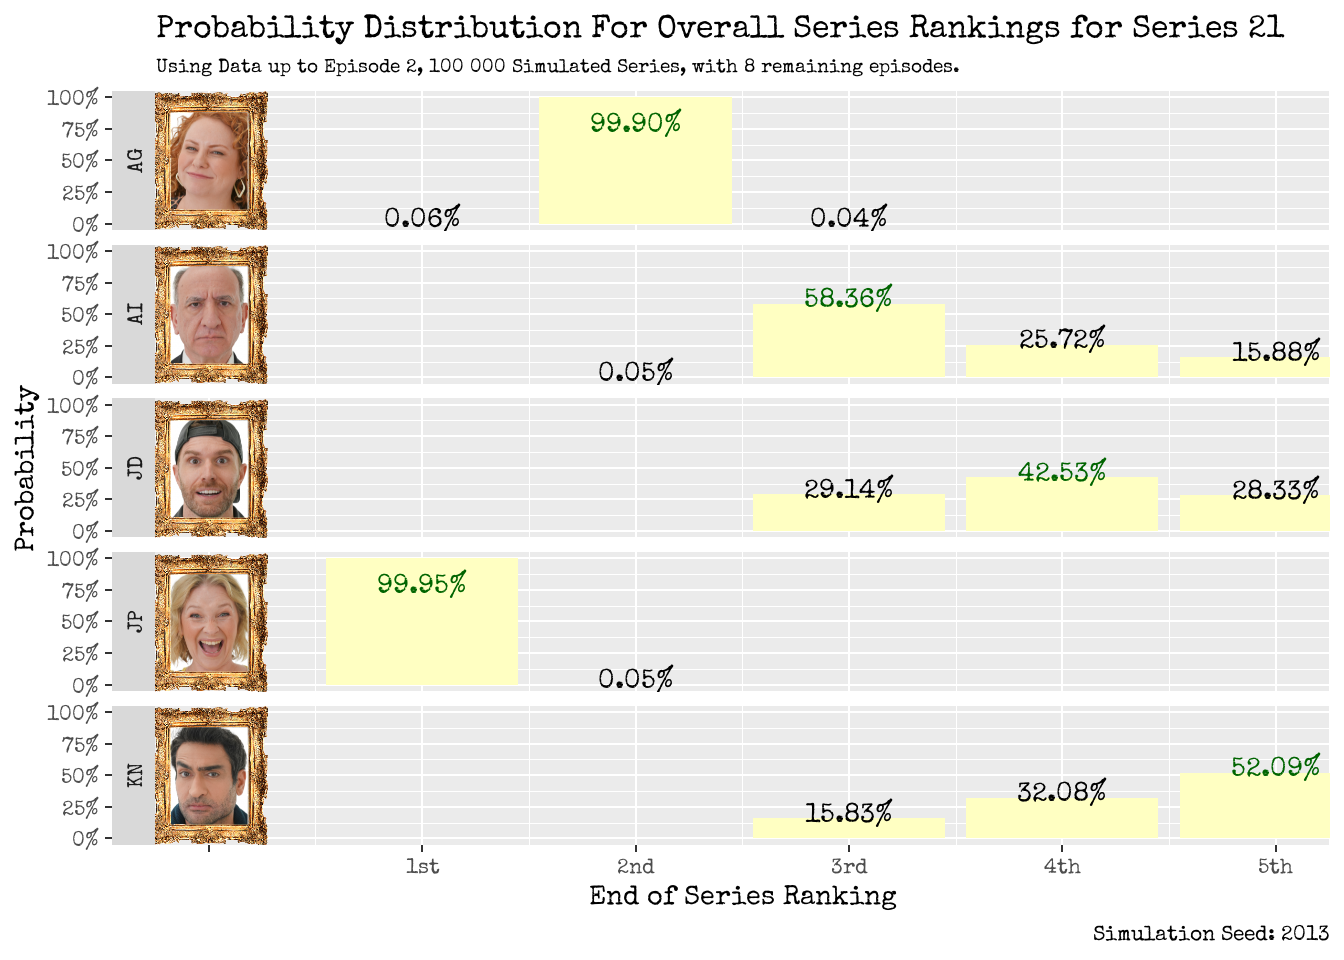
From Figure 17 which shows the marginal predictive distributions for each contestant’s end of series placement:
- Amy and Joanna’s distribution have retained the same shape and peakiness. Their peaks are still centered on 2nd and 1st respectively, with a negligible decrease. This decrease is also aligned with the outcome of Episode 2.
- The men’s distributions have exhibited the greatest change in shape and location of peaks. Almost all probability is allocated to whether they will place 3rd, 4th or 5th in the series, and these probabilities have become flatter compared to the prior week.
- These flatter distributions represent the increased uncertainty of how the men will place in the series overall. This flattening is also expected based on the outcome of Episode 2 in which the playing field has become more level amongst the men.
- The **most probable series outcomes are:
- Amy: 2nd with 99.90%; previously** 2nd with 100%.
- Armando: 3rd with 58.36%; previously 4th with 50.13%.
- Joel: 4th with 42.53%; previously 3rd with 60.72%.
- Joanna: 1st with 99.95%; previously 1st with 100.00%.
- Kumail: 5th with 52.09%; previously 5th with 88.43%.
Figure 18: Is Joanna’s end of series placement distribution going to share the same fate as her handstands?

Joint Cast Ranking Distributions
Figure 19: Joint Distribution of Cast Series Ranking: Using Data up to Episode 1 (left), and up to Episode 2 (right).
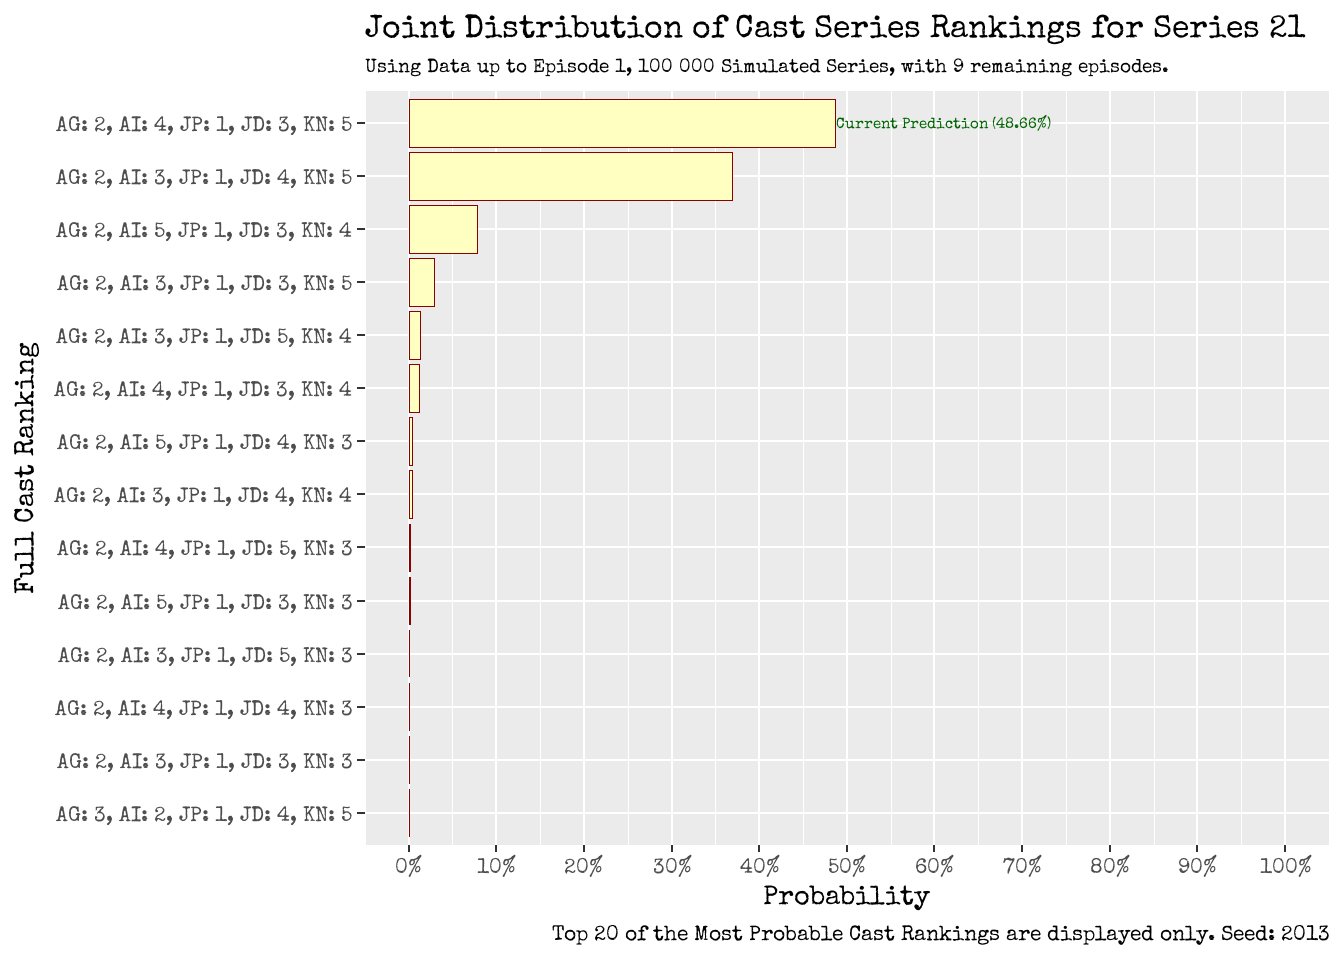
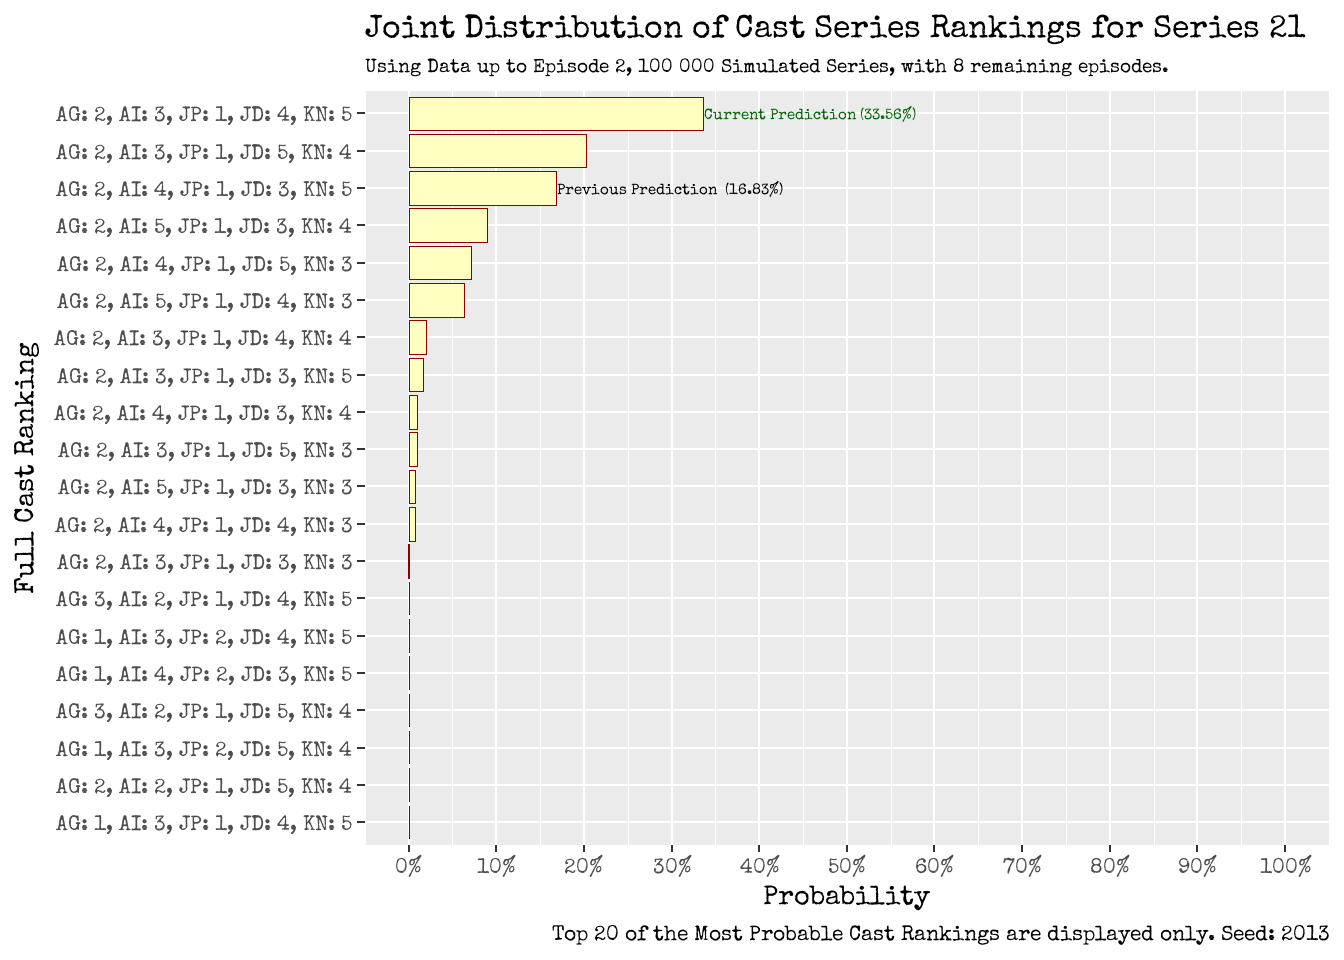
Figure 19 shows the joint cast distribution of how they will all collectively fair by the end of the series.
- The most probable cast outcome is
[1st: Joanna, 2nd: Amy, 3rd: Armando, 4th: Joel, 5th: Kumail]with 33.56%.- The previous week’s most probable cast outcome was
[1st: Joanna, 2nd: Amy, 3rd: Joel, 4th: Armando, 5th: Kumail], and now has 16.83% chance. The difference between these two outcomes is whether Joel or Armando will place 3rd and 4th.
- The previous week’s most probable cast outcome was
- As alluded to in the marginal distribution of Figure 17, the outcomes which have an estimated probability of more than 5% are all variations on how the male contestants will fill the positions of 3rd, 4th and 5th.
- Further down the combination list, we do see Amy and Joanna not placing 2nd and 1st respectively, but the chances of these occurring are less than 5%.
Figure 20: The real winner of Taskmaster is of course Little Alex Horne!

What Have We Learnt Today?
Figure 21: Alex laughing at my blog and commentary. One can only hope!

We’ve learnt that:
- This series is currently looking like a female led series.
- After two episodes, the most likely cast series rankings are
[1st: Joanna, 2nd: Amy, 3rd: Armando, 4th: Joel, 5th: Kumail]with 33.56%. - Joanna and Amy are estimated to place 1st and 2nd in the series with near certainty.
- The uncertainty (and excitement) will likely come from how the men will finish in the lower half of the series rankings.
- Will age and wisdom (Armando) triumph to 3rd place, or will the muscled arms of Hollywood (Kumail) soar to 3rd place?
- After two episodes, the most likely cast series rankings are
- We’ve also compared the cast of Series 21 to prior contestants that have come before them.
- We have made these comparisons by comparing their average episode score and the standard deviation (volatility), at comparable points in the series.
- We have also built neighbourhoods around the Series 21 contestants, based on how similar their average and standard deviation is to prior contestants. These neighbourhoods also provide an alternative way for us to make predictions on series rankings.
- I am carrying CABBAGE BAGGAGE; I’m procrastinating and (claim to be) suffering from statistical writers’ block.
- Don’t worry, I’ve inflicted a self punishment of not being able to watch Episode 3 until this post is published.
Figure 22: Some much needed refreshment to continue my own personal side project.


Is this even a thing?↩︎