Series 19 Retrospecive Part 2: The Qrstuv-ies
Your Task
Host the inaugral Qrstuv-ies, an unofficial data-driven Taskmaster Awards ceremony which celebrates the latest series of UK Taskmaster.
What’s your Favourite Season? … Mine is the Awards Season
For the tl;dr generation….and the Winners are
Figure 1: Series 19 Qrstuv-ies Winners
And Here Are My Workings…
Your Average and Standard (Deviation) Statistical Analysis
Table 2 shows overall summary statistics for the points awarded for each contestants task attempt across the series. Each contestant has a boxplot to provide insight into the distribution and spread of the points awarded, and explicitly present the average points awarded (via the mean and median), and variation in points awarded (via the standard deviation and interquartile range). We generate these statistics for all tasks, and each task type (Prize, Pre-Recorded and Live).
Figure 2: Summary Statistics for Contestant Performances
Using on the mean average points awarded per task to determine the best performing contestant:
- Mathew Baynton achieved the highest average points across all task types and is thus considered our Most Valuable Player.
- Mathew was also in fact the highest average point scorer for both Prize and Pre-Recorded tasks, and was the second highest performer for live studio tasks. His high performance in each of these task types evidently contributed to his high performance across all tasks in the series.
- Stevie Martin was the highest performer for live studio tasks.
Using standard deviation of points awarded as a our measure of how volatile a contestant is and thus how unpredictable a contestant is:
- Mathew Baynton is the least volatile contestant of Series 19, and thus the most predictable.
- Honourable mention to Rosie Ramsey who would have been the least volatile contestant of Series 19, had it not been for the “Fail the task in the most heartbreakingly spectacular way” pre-recorded task in Episode 8 where she was award “-1”.
- This is further confirmed as Rosie exhibits the least amount of variability for Prize and Live Tasks.
- Fatiha El-Ghori was the least volatile (and most predictable) for Pre-Record tasks.
- Honourable mention to Rosie Ramsey who would have been the least volatile contestant of Series 19, had it not been for the “Fail the task in the most heartbreakingly spectacular way” pre-recorded task in Episode 8 where she was award “-1”.
- Jason Mantzoukas is the most volatile contestant of Series 19, and thus the least predictable
- His high volatility did seem apt seeing as his series motto was “Destroy, dismantle, and engulf in flames.”1 and he has later remarked that “I feel like my best mode is chaos.”2.
- Jason was the most volatile during the pre-record tasks, and the second most volatile in live tasks. Given that pre-recorded tasks account for 60% of tasks in a series, this provides insight as to why Jason is the most volatile contestant of the series.
- Stevie is the most volatile contestant for Live tasks. It’s interesting to observe that Stevie is both the best performer for live tasks and also the most volatile for live tasks. A true chaotic being!
- It’s heartwarming to see the dynamic duo of Javie Martzoukas continuing to chaotically rule the volatility leaderboard; Stevie Martin is the second most volatile contestant after Jason.
Figure 3: Javie Martzoukas: Chaotically ruling the volatility leaderboard of Series 19.

Some Boring Stats Commentary
The average points awarded to each contestant (through the mean and median), and the ranking of these averages across the contestants is in line with the final outcome of the series. That is, Mathew has the highest average points (both in mean and median), and was also crowned champion of the series. This is an expectant phenomena as in order for Mathew to be crowned champion, he had to perform the best on average.
Both the mean and median are presented to provide comparison as to potential benefits and drawbacks to these two statistics which both capture the “average” behaviour. The mean is more nuanced and shows greater idiosyncrasies for each contestant (look at those decimal places), where as the median does not vary greatly across contestants (4 out of 5 contestants have a median of 3 points) and may thus not be ideal in definitively ranking contestants performance.
In terms of points variation, Mathew has the smallest variability according to standard deviation, but if we measure this via interquartile range, this would be awarded to Rosie.
But why is this? Well Rosie has one outlier according to the boxplot in the form of a -1. This was awarded in the “Fail the task in the most heartbreakingly spectacular way” task in Episode 8, in which she failed the task by succeeding in it.
Standard Deviation (and mean) are influenced by the presence of outliers, whereas the IQR is not. Hence, Rosie is exhibits more variation according to standard deviation due to this outlier, whereas she is not penalised as much according to the IQR (it is just 1 out of 50 tasks performed in the series).
Ch-ch-changes
Quarter-by-Quarter
Figure 4: Change in Average Points Awarded in the last quarter of the series.
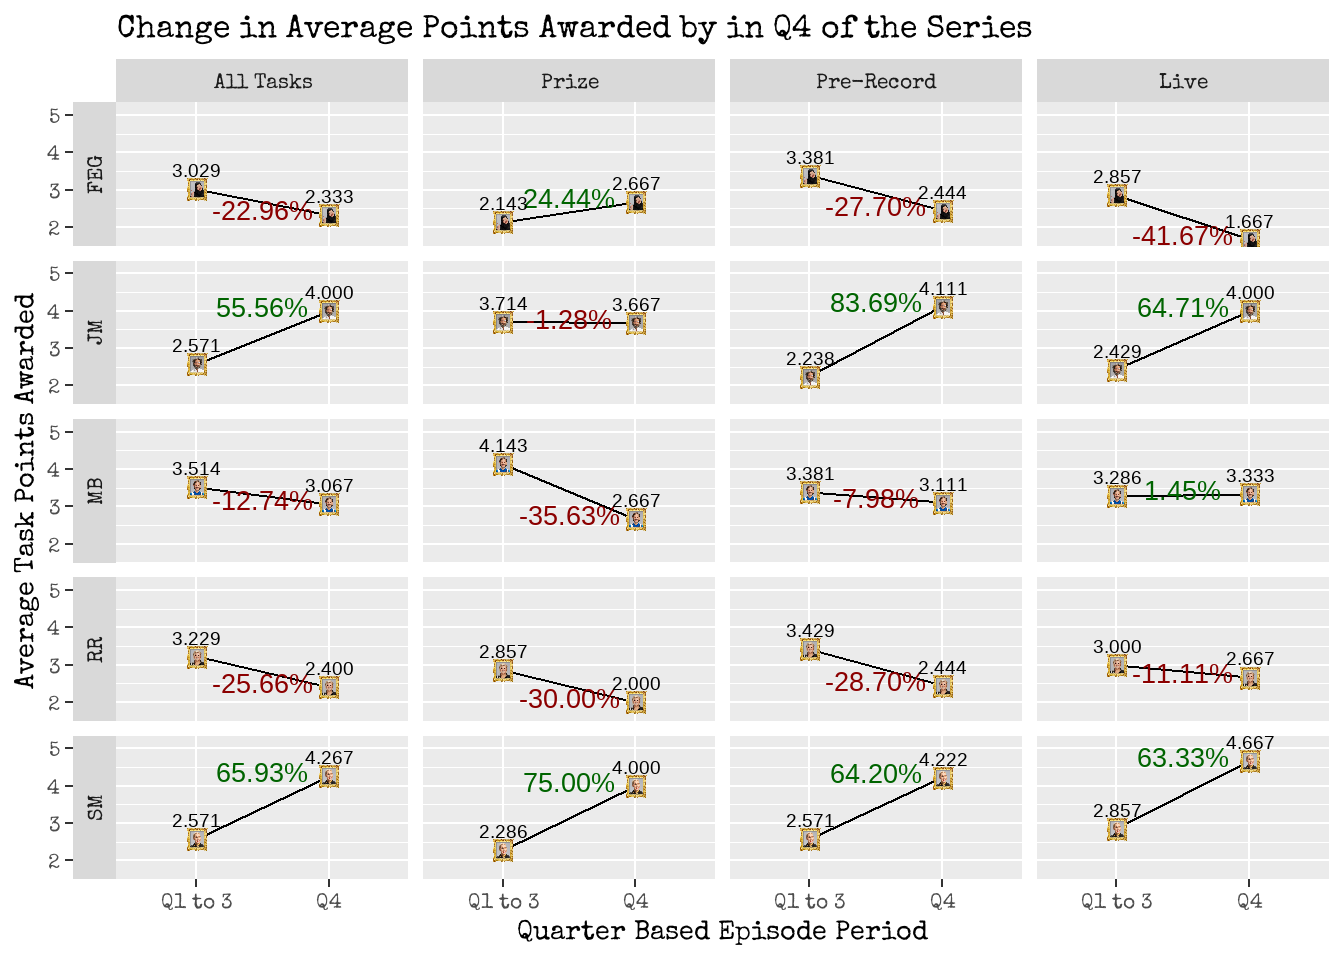
Figure 4 shows each contestants change in average points awarded between first \(\frac{3}{4}\) of the series (episodes 1 to 7, referred to as Q1 to 3) and the last \(\frac{1}{4}\) (episodes 8 to 10, referred to as Q4). We consider changes in averages for all tasks and each task type, as an attempt to track progress of contestants over the series.
- Stevie Martin showed the most improvement in task performance when comparing her Q4 performance to Q1 to 3. She achieved 65.93% more average points in Q4.
- This improvement is seen in all three task types (prize, pre-record and live).
- This improvement is also in line with Stevie surprisingly finishing 2nd in the series.
- Mathew Baynton maintained his performance during Q4 compared to Q1 to 3. His average points awarded changed by only -12.74% and was the closest to 0%.
- Mathew’s largest degradation in performance was for prize tasks (-35.63%). One hypothesis to this degradation is that Greg was judging Mathew more harshly in the last quarter (compared to the first three) due to Mathew becoming the clear winner of the series early on. Greg, whether intentionally or not, could have under marked him more in latter prize tasks in order to close Mathew’s lead, and provide some jeopardy to the series.
- Rosie Ramsey showed the greatest degredation in task performance and needs to see me (or should that be the Taskmaster) after class. She saw a 25.66% drop in her average points awarded for Q4.
- This degradation is mainly seen in the prize and pre-recorded tasks, with pre-recorded tasks carrying the most weight.
Other observations:
- Jason Mantzoukas was the second contestant to show the most improvement over the series after Stevie. He saw an increase of 55.56% in his average point awarded for all tasks.
- This increase is largely attributed to pre-record and live tasks improvements. He was relatively consistent in his prize task performance and saw minimal (potentially insignificant) changes of 1.28%.
- Jason’s improvement is also in line with Jason finishing third in the series in a somewhat surprising manner.
- Fatiha El-Ghorri was the second contestant to show the most degradation in performance over the series after Rosie. She saw a degradation of 22.96% in her average points awarded.
- This degradation is attributed to pre-recorded tasks (most common task type, and thus greatest influence), and also live tasks.
- Her live task performance degraded by -41.67% which is not surprising given that Fatiha memorably gave up in the live tasks in Episode 1 and 10 such that she ranked last in them.
By Episode
We can also monitor the progress of contestants performance over the series by plotting it by each episode, rather than by quarters.
Figure 5 shows each individual task attempt point over time (Episode) for each contestant. The flat horizontal green line represents the average task points awarded across the series The varying red line represents the average task points in that episode. Some slight jitter has been added to prevent overlapping of points.
Figure 5: Awarded Points over Time
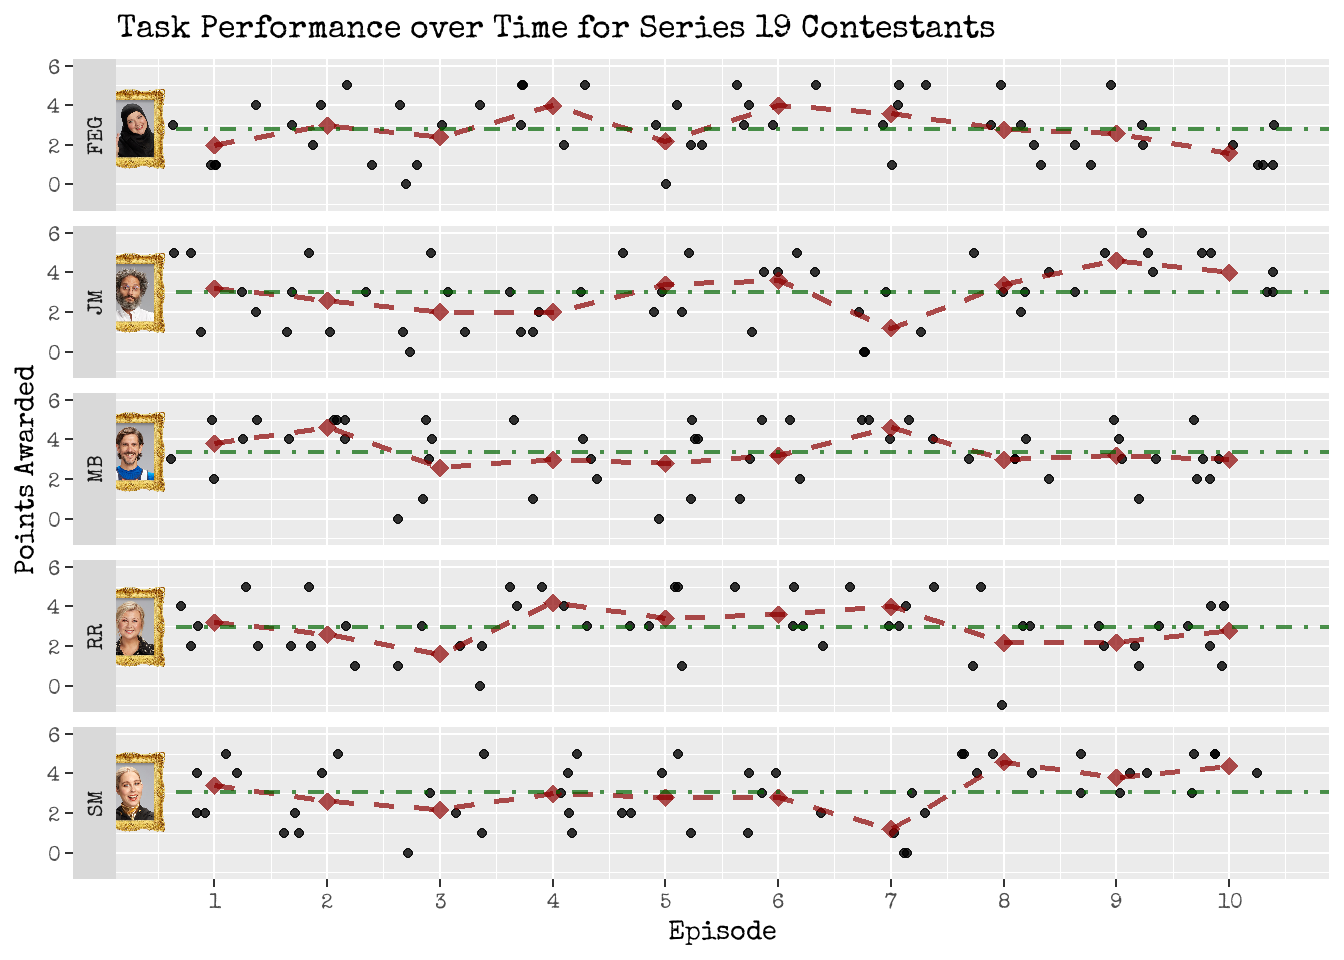
From Figure 5, we can clearly see each contestants high and low points in the series:
- Fatiha’s best episode was in episode 4 or 6. From episode 6 onwards, her performance was on a slow decline, with her episode 10 performance being in line with her episode 1 performance.
- Jason’s worst episode was in episode 7; after this he redeemed himself which concurs with the quarter analysis we previously performed.
- Prior to this, he had a small lill in performance from Episode 1 to 4, but not as severe as Episode 7.
- There are no obvious peaks or troughs in Mathew’s performance. Each episode’s point average is not deviating too much from the overall series average; this is not particularly surprising given that Mathew was the least volatile and most predictable contestant.
- If we were to isolate Mathew’s peak and trough, Episode 2 and 7 would be the most potential peak candidates, whilst Episodes 3 to 6 are candidates for his lull.
- Rosie had a high performing streak between episodes 4 to 7; episode 3 was her lowest point in th e series.
- Stevie shares the same low point as Jason, that being Episode 7.3 However, she immediately followed this with her spectacular redemption arc and performed her best from Episodes 8 to 10.
- This is also supported by her improvement in the quarter based analysis.

There’s an I in Team
Figure 6 provides a visualisation of each contestants average task performance for non-prize tasks (contestant image), and the influence of average solo and team task performance on this overall average (ends of the lines). We also presetnt the percentage difference of a contestants team task performance over their solo task performance, to provide insight as to how different their team performance was to their solo performance.
Figure 6: Visualising contestants overall average task performance and how this is influenced by solo and team task performance.
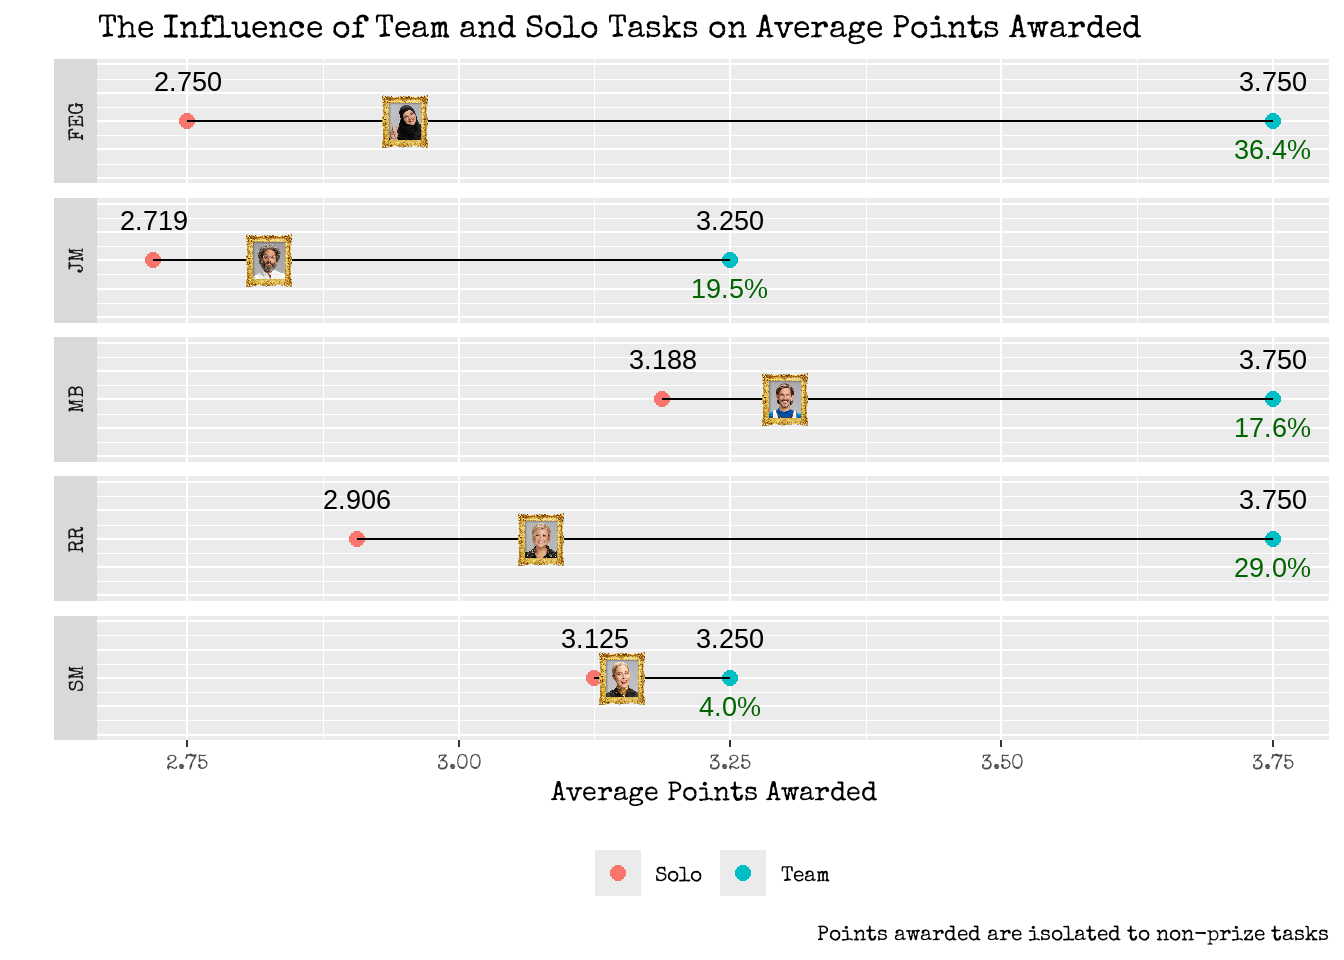
- For all contestants, their team task performance was better than their solo task performance; the average points awarded were higher in team tasks than solo tasks.
- This particular observation (team task performance is better than solo task performance) indicates that all contestants benefited from team tasks and raised the average points awarded for all non-prize tasks.
- I would be intrigued to see if this phenomena (that team task performance is greater than solo task performance) is true for all contestants in the history of the show, and if there are any incidents where team task performance was worse than solo task performance. For example, it is entirely plausible that Dara O’Brian (Series 14) or John Robbins (Series 17) were actually hindered by their teams, and thus did not benefit from team tasks.
- The team of Fatiha, Mathew and Rosie (Fatosie El-Ramton) were the better performing team, achieving an average of 3.750 points per team task.4
- In contrast, Javie Martzoukas were awarded an average of 3.250 per team task.
- Only 0.5 points separates these two teams and so the award of “best team” can be considered a close call. If only Javie Martzoukas were fully locked in…
- Fatiha El-Ghorri benefited the most from team tasks. Her team task performance was 36.4% more than her solo task performance.
- Stevie Martin benefited the least from team tasks. Her team task performance was only 4.0% more than her solo task performance.
Figure 7: Javie Martzoukas: Locking in a memorable team name


What Have we Learnt Today?
- We’ve provided data-driven recognition and awards to those who weren’t crowned the champion of Series 19.
- Saying this, Mathew did win many of our silly fictional awards and is now proven to be the most consistent and predictable contestants of Series 19.
Figure 8: Sharing the love and adoration of Series 19 through data driven means.

- We’ve learnt that if I am seem more relevant and timely in this world and industry, I need to be more efficient and prompt in performing this analysis and publishing posts about it. This is regardless of what Stevie’s best intentions were.
Figure 9: A hopeful approach for Series 20…


- We’ve learnt that it is time to take apart this Series 19 (data)set and start looking at Series 20 more seriously…
Figure 10: A visual representation of taking apart the Series 19 (data)set.

“I feel like my best mode is chaos.” Jason Mantzoukas on his heel turn in Taskmaster, one of his favorite shows↩︎
Javie Martzoukas forever!↩︎
But do they have as memorable a team name as Javie Martzoukas?! Fatosie El-Ramton just doesn’t have the same ring to it…↩︎