Series-ly, Take a Chance on Me
Your Task
For each contestant of the Series 19 of UK Taskmater, generate probability distributions on their series rank. Bonus points for also generating proability distribution on each contestant’s series points accumulated by the end of series.
For example, estimate the probability of Jason Mantzoukas placing 5th by the end of series, and accumulating 140 or more points by the end of the series.
Previously on The Median Duck…
In a previous post, ‘May the Odds Be Your Favour’, we proposed a new method to estimate probability distributions associated with a contestants placement within an episode. This approach, the MultiVerse approach1, was a simulation based sampling method in which we sampled from existing (contestant, task) observations from broadcasted episodes, and created alternative timelines.
These alternative timelines allowed us to create probability distributions, even for events that have not been observed yet. For example, we estimated the probability of Matthew Baynton placing 5th in a episode was only 5.80% using data up to and including Episode 8. This is despite the fact that so far up to and including Episode 9, Matthew has never placed in 5th position for an episode.2
We can continue to extend this methodology to estimate overall series statistic distributions. For example, a contestant’s placement at the end of the series, and the total number of series points accumulated.
The Ultimate Pen … is the Penultimate
What a difference an episode makes, or has it? Before proceeding with the task in hand, we re-run our MV approach using data up to and including Episode 9; we previously only ran it using data up to Episode 8.
The Series 19 Tracker (Figure 1) shows that:
- Matthew continues to dominate this series and has widen his first place advantage compared to the other contestants. Matthew has a good 20 point advantage.
- This looks like a one horse race and has been for a while.
- For the remaining contestants, Episode 9 definitely tightened up the race for second and below placements.
- There are only 5 points separating all four contestants.
- The horse race is most likely the most exciting (and uncertain) for the second and below placements.
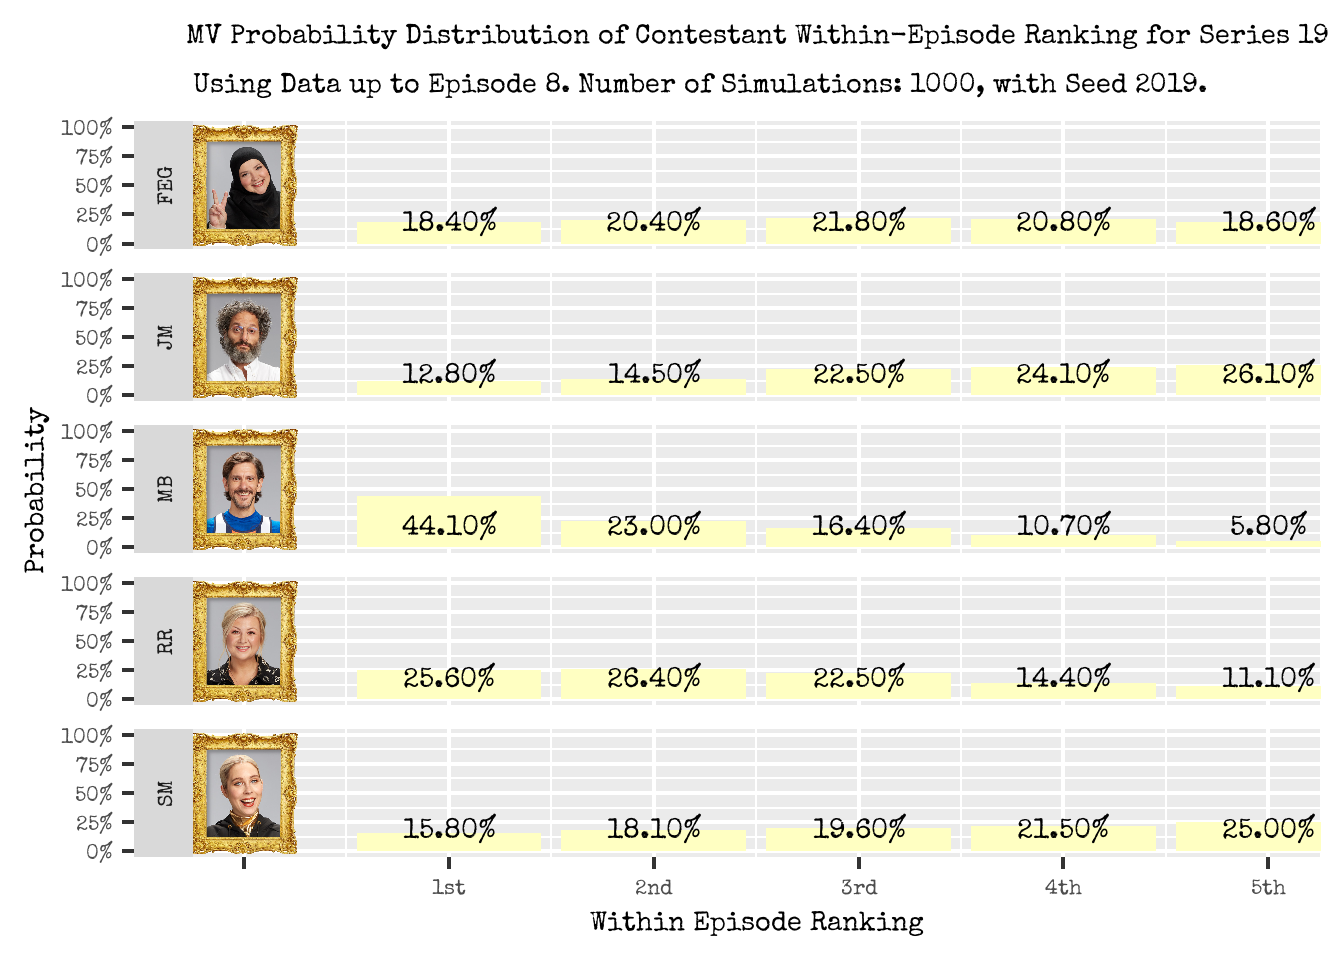
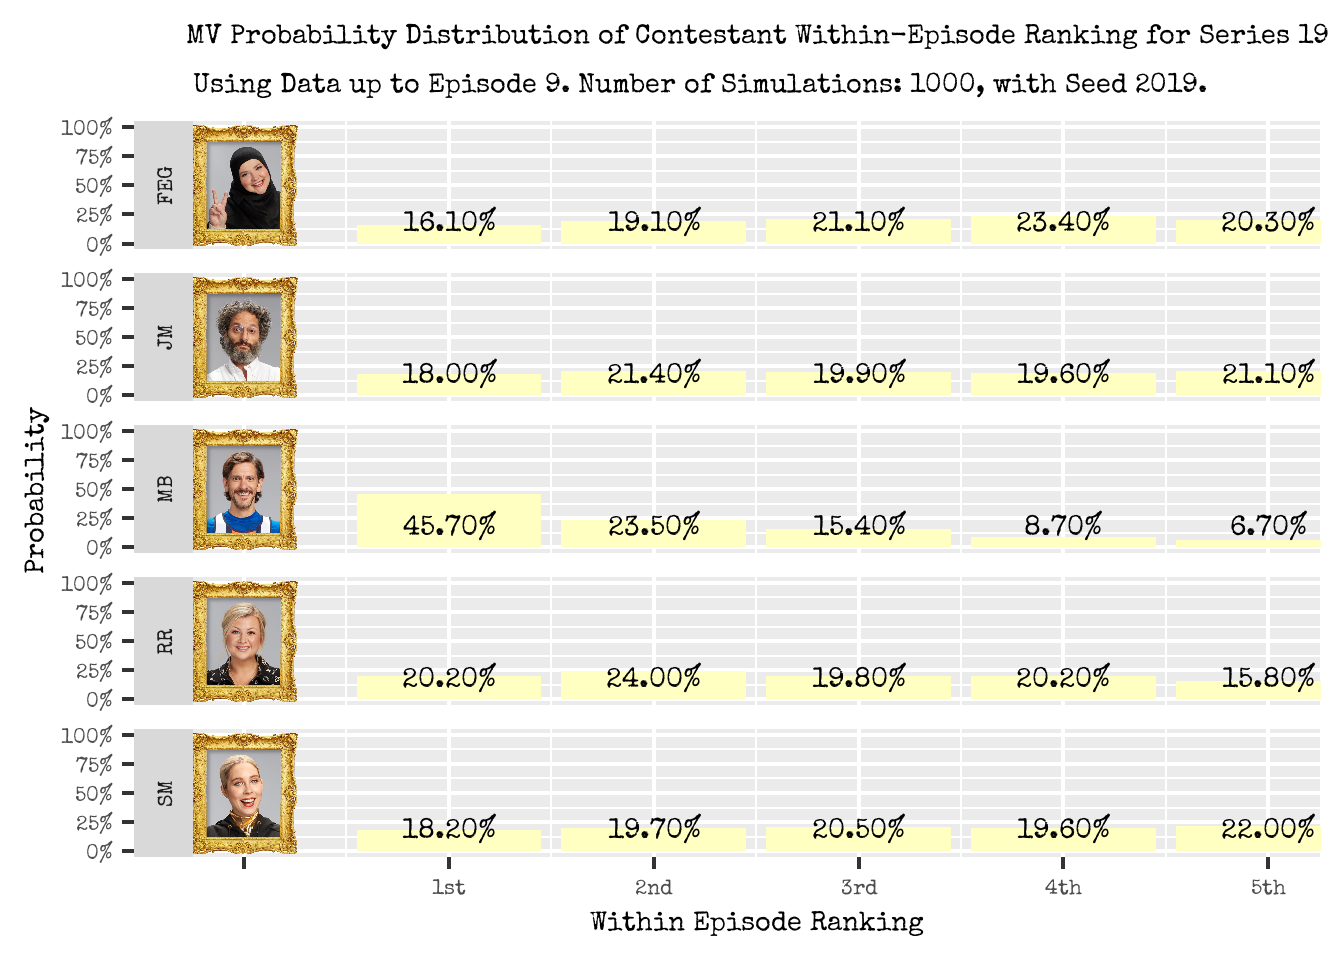
From our update probability distributions episode of wins (Figure 2, updated with Episode 9 tasks being included):
- There are some slight changes in the episode win distributions using up to Episode 8 data; prior distribution.
- As Jason won Episode 9, his new distribution reflects this. He previously had 12.80% chance of winning an episode (up to Episode 8), but now has 18.00% chance of winning (up to Episode 9).
- Rosie placed last in Episode 9. She previously had 11.10% chance of placing 5th in the episode (up to Episode 8), but this has now increased to 15.80% when including the latest episode data.
- Matthew’s likelihood of winning an episode has increased from 44.10% (up to Episode 8) to 45.70% (up to Episode 9). Matthew placed third in Episode 9; he performed poorly in the “Give Patatas the elixir” task (he placed last) and was middling elsewhere. This middling performance did not negatively impact his probabilty of winning future episodes.
- Fatiha and Stevie however, both saw the probability of them winning future episodes decline. They placed 4th or 5th for the majority of tasks in the episode which evidently has impacted this probability.
Figure 1: Series Performance so far for Series 19.
Figure 2: Probability Distribution of a Contestant Placement within an Episode, based on the MultiVerse method.
Series-ly, What’s the Situation?
Insights on episode wins are all well and good, but insights on the overall series wins and statistics is where the real money is.3
Wait, what, what wait?
To get distribution on series related statistics, we simply combine the observed information we have seen to date for the series, and the episode simulations.
This combined result gives us simulations pertaining to the full series from which we can use to generate probability distributions from.
Figure 3 shows the probability distribution of a contestant’s series ranking.
- We have estimated that Matthew will win the series with 100%. This is not entirely surprising given that:
- Matthew has a 20 point lead going into the finale.
- Typically, the minimum and maximum number of points a contestant can be awarded is 5 and 25 (assuming no disqualifications or joker mechanics).
- Matthew has been one of the stronger contestants in the series in terms of task performance.
- For the other contestants:
- Fatiha has a relatively flat distribution, peaked slightly around placing 3rd; Fatiha is most likely to place 3rd with a probability of 36.50%.
- Jason has a distribution that is skewed towards the lower rankings. Jason is most likely to place 5th with a probability of 46.90%.
- Rosie’s ranking distribution is skewed to the higher rankings; Rosie is most like to place 2nd in the series with a probability of 61.60%.
- Stevie’s series placement distribution is relatively flat, but peaked around placing 4th. Steveie is most likely going to place 4th with a probability of 30.10%.
Figure 3: Probability Distribution of a Contestant Series Ranking, based on the MultiVerse method.
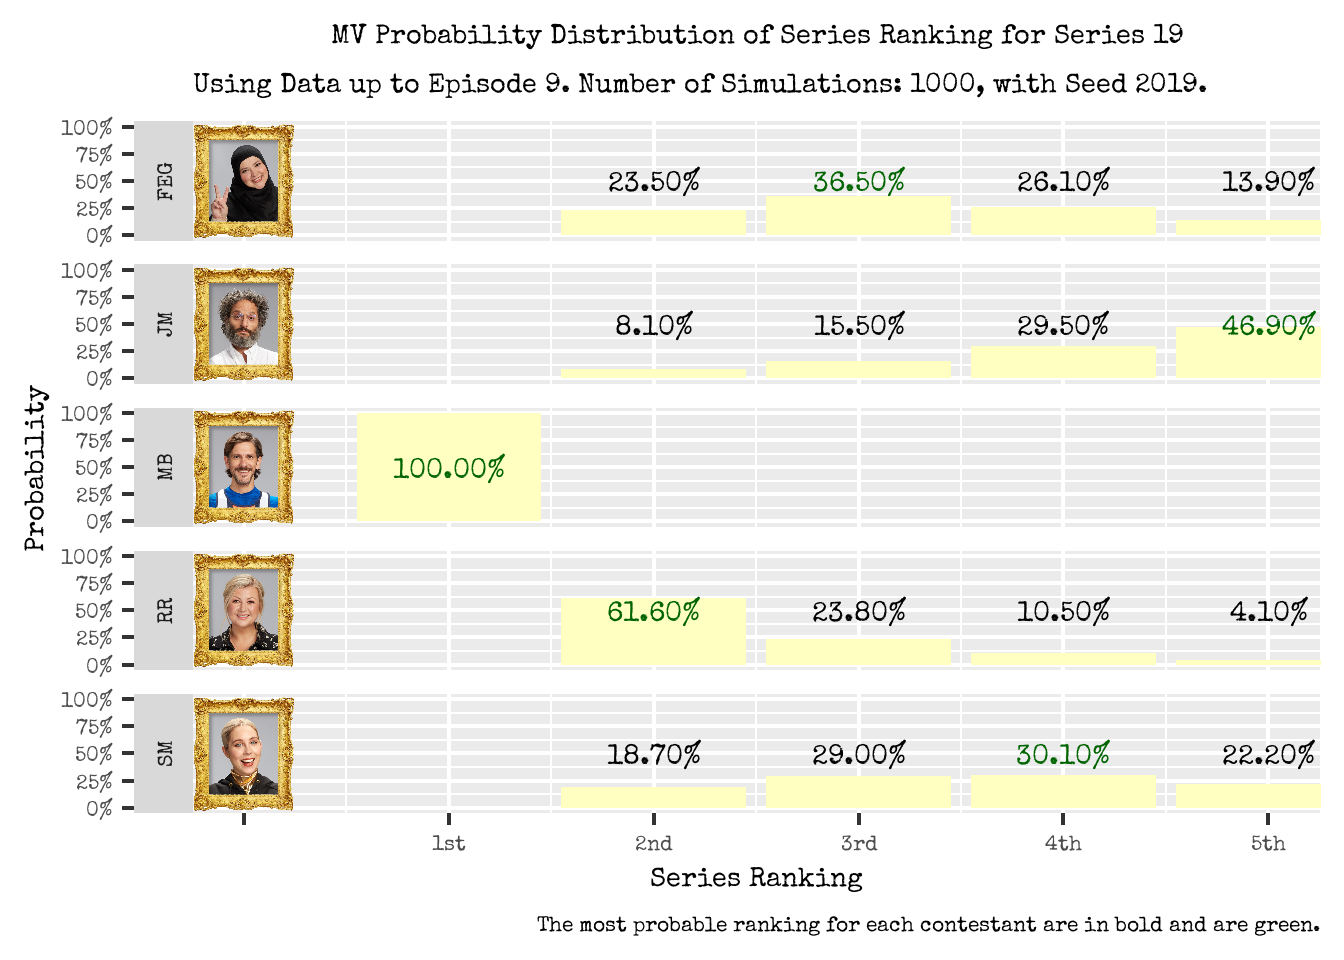
Figure 4 presents histograms of each contestant’s series points, and Table 5 presents summary statistics of these distributions.
- For all contestants, their series points histograms could plausibly follow a Normal/Gaussian distribution with different averages. They all exhibit the typical symmetrical bell shape curve which is peaked in the middle.
- The actual values of the Mean (average) and Median being within 0.5 of each other also supports this Normal distribution hypothesis.
- The relatively small and comparable differences of percentiles to the median also support the symmetrical distribution hypothesis. That is:
- (P75-Median) \(\approx\) (Median - P25)
- (P90-Median) \(\approx\) (Median - P10)
- What the histograms are centered around differ for each contestant, and are in line with the most probable rankings as indicated in Figure 3.
- Matthew’s distribution is furthest to the right, and is centered around the highest average series points of 168.98. Matthew’s most likely placement was 1st.
- Rosie’s distribution follows next; her distribution is second furthest to the right and she was most likely to come 2nd. Her series points distribution is centered around an average of 147.84.
- Fatiha and Stevie’s series points distribution are very similar in what they are centered around (145.28 and 144.40). This similarity in series points distribution is potentially not surprising given their relatively flat and similar series ranking distributions (see Figure 3)
- Jason’s series points distribution is furthest to the left and is not surprising given the he was most likely going to place 5th according to our simulations. His series points distribution is centered around 142.42.
- We have also plotted a vertical line at 140 series points to provide a sense of how likely each contestant will achieve a score which is more than this threshold.
- From eye balling in Figure 4, contestants are likely going to satisfy this event with the following probabilities.
- Fatiha: 90-95%
- Jason: 80%
- Matthew: 100%
- Not surprising given that he ended Episode 9 with 154 points already.
- Rosie: 99%
- Stevie: 90-95%
- A more accurate probability estimate of this event can be inferred from Table 5:
- Jason for example, first exceeds 140 points at the P25 percentile. The P25 represents that 25% of Jason’s series points will be below 140. Consequently, by taking the complement, we estimate that Jason will score more than 140 points in the series with probability 75%.
- From eye balling in Figure 4, contestants are likely going to satisfy this event with the following probabilities.
Figure 4: Series Score Distributions using the MultiVerse Probability Estimation Approach.
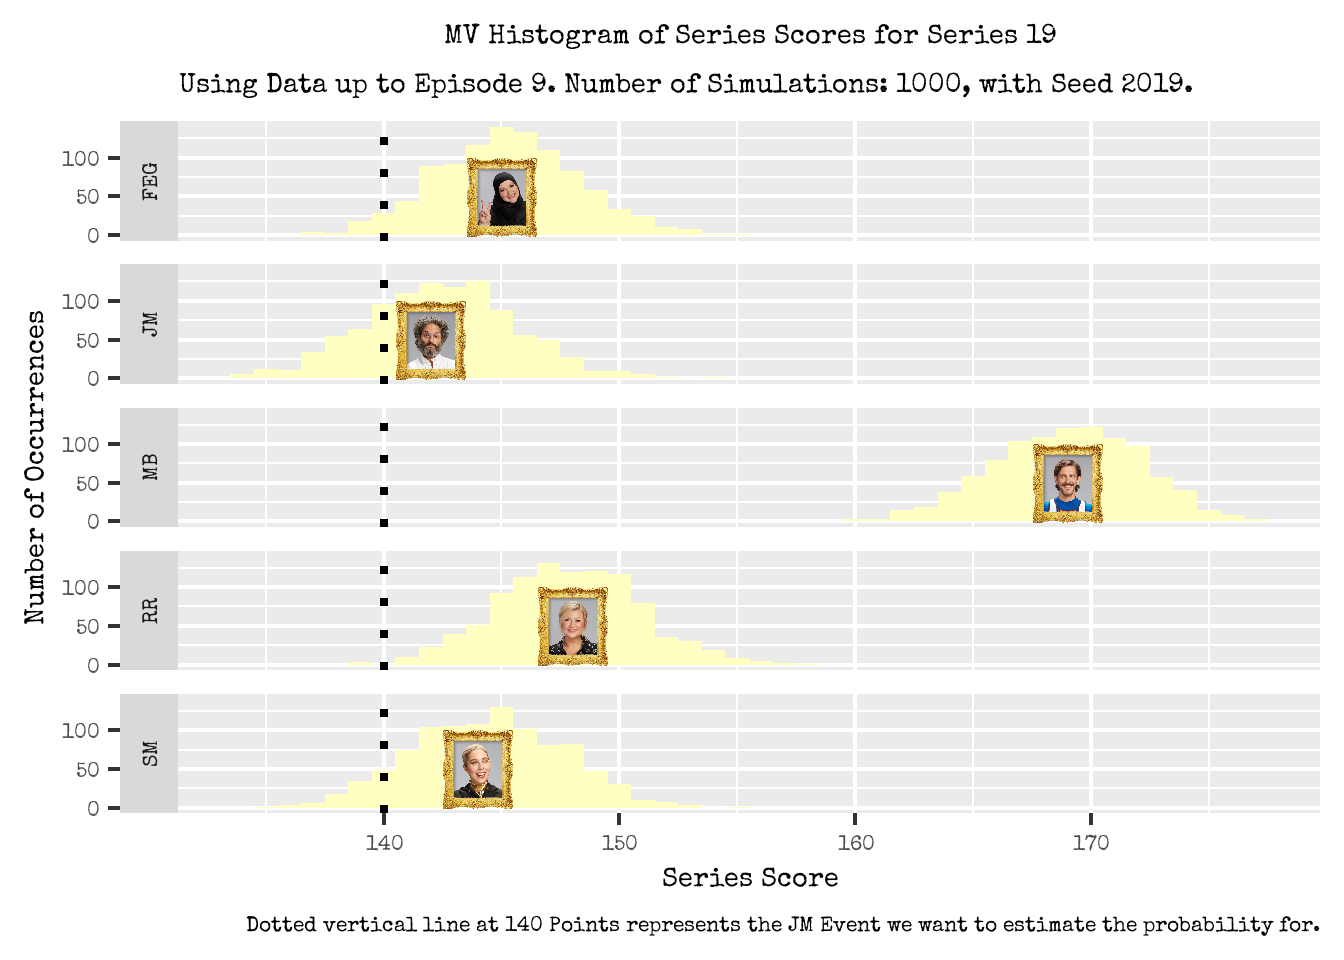
Figure 5: Summary Statistics of each Contestant’s Series Points Distribution
Load Me … I’m Locked In
But wait, what if want to get an even more accurate probability estimate of Jason Mantzoukas scoring at least 140 points by the end of the series?
Well, we can calculate this more precised by counting the number of times this event occurred in our simulation (the event being Jason scoring at least 140 points), divided by the number of simulations that is performed.
That is:
\[ \texttt{Probability of Jason scoring at least 140 points} = \frac{\texttt{Number of times Jason scored at least 140 points in our Simulations}}{\texttt{Number of Simulations Performed}} \] Using this equation, we estimate the probability of Jason scoring at least 140 points by the end of the series to be 82.00%.
In general, we can estimate the probability of any event occurring with the following equation:
\[ \texttt{Probability of Event Occurring} = \frac{\texttt{Number of times Event occurs in the Simulations}}{\texttt{Number of Simulations Performed}} \] From this we also have probabilities for the following events:
- Probability of Jason placing 5th in the series: 46.90%.
- Probability of Jason placing 5th in the series and scoring at least 140 points in the series: 29.60%.
Catch of the Day
Great, we have a way to estimate probabilities associated with events in Taskmaster. Job done, stop the clock!
However, my internal humble self would like to highlight that this is one way to estimate probabilities; but it is not the only way to estimate probabilities. There are plenty of disclaimers and limitations to this method to be made in case any of my limited number of readers thinks they can use this method to spend all their life savings betting on Taskmaster outcomes.
- Our insights are rooted in data and what has been observed so far in the status quo.
- Whilst we estimated that Matthew would win the series with 100%, there is potentially still a very small chance (very close to 0), that Matthew doesn’t comes first in the series.
- Cheeky Little Alex Horne could come up with some new, unconventional game mechanic in the final episode (for example, points are worth 10 times as much in a particular task, there’s a points switch-a-roo between contestants).
- The MV method would not be able to account for these unforeseen and unconventional if they had not occurred yet.
- Our approach could be more representative of some Taskmaster mechanics which are common seen across series. This includes:
- Accounting for the differences between solo and team tasks.
- Accounting for the mix of subjective and objective tasks in an episode.
- It would be extremely rare to see an episode full of only subjective or objective tasks.
- Accounting for the mix in task locations that are seen in a single episode.
- An episode of Taskmaster rarely features tasks only performed in one location. Task locations are generally varied within a single episode.
- Limited data: What do we do before a series has even started and we have no data directly associated with how that series of contestants has performed in tasks.
- We may have to rely on data from prior series for this.
What Have We Learnt Today?
We’ve learnt:
- We have extended our MultiVerse approach to estimate probability distributions associated with series events, not just episode events. Events include:
- A contestant’s overall series ranking.
- A contestant scoring more (or less) points over the series.
- A contestant ranking in a certain position, and also satisfying a score criteria.
- And many more!
- If I want to seem relevant with my methods and findings, I should perform this analysis whilst this series was happening ideally.
- Time to get my time management act together and work on code refactoring and standardisation!
- Whilst our method is in no ways perfect and can be improved to capture more common and intricate mechanics seen in Taskmaster, we do have a method to generate probability distributions and that is at least a starting point.4

Naming of method was driven by wanting to seem hip and cool.↩︎
Who knows what will happen in Episode 10? It is still possible that Matthew could place in 5th position, but it is highly unlikely based on our estimated probability which is based on his past performance in tasks to date.↩︎
The number of episodes a contestant wins is not necessarily indicative of whether they will win the series; the points a contestant is awarded are ultimately what determines how you will perform in a series. Of course, performing well in tasks usually means that you win and place higher in an episode. But it is entirely plausible that a contestant who consistently places second but only misses out on the top spot by a few points, could end up as the series winner (if the episode winner is inconsistent in performance, or there is variability in who wins the episode).↩︎
And I suppose this could mean that we can take odds and bets associated with Taskmaster now…↩︎