Series 19 Retrospective Part 1: Sharing the Same Juice
Your Task
With Series 19 having concluded, compare the predictions that were made on Series 19 outcomes (final series contestant rankings, series points accrued by each contestant) with the actual outcomes (those at the end of episode 10 and the end of the series).
The aforementioned Series 19 predictions were discussed in a prior post. These predictions were made using data up to and including Episode 9 of Series 19, on for standings at the end of the series (after Episode 10).
Predictions using more limited data (that is using fewer1 broadcasted episodes), could also have been made, but these predictions are likely going to be less accurate. This is a task for another time however…
The Current Timeline
Figure 1: Series 19 Actual Cast Rankings and Series Scores.
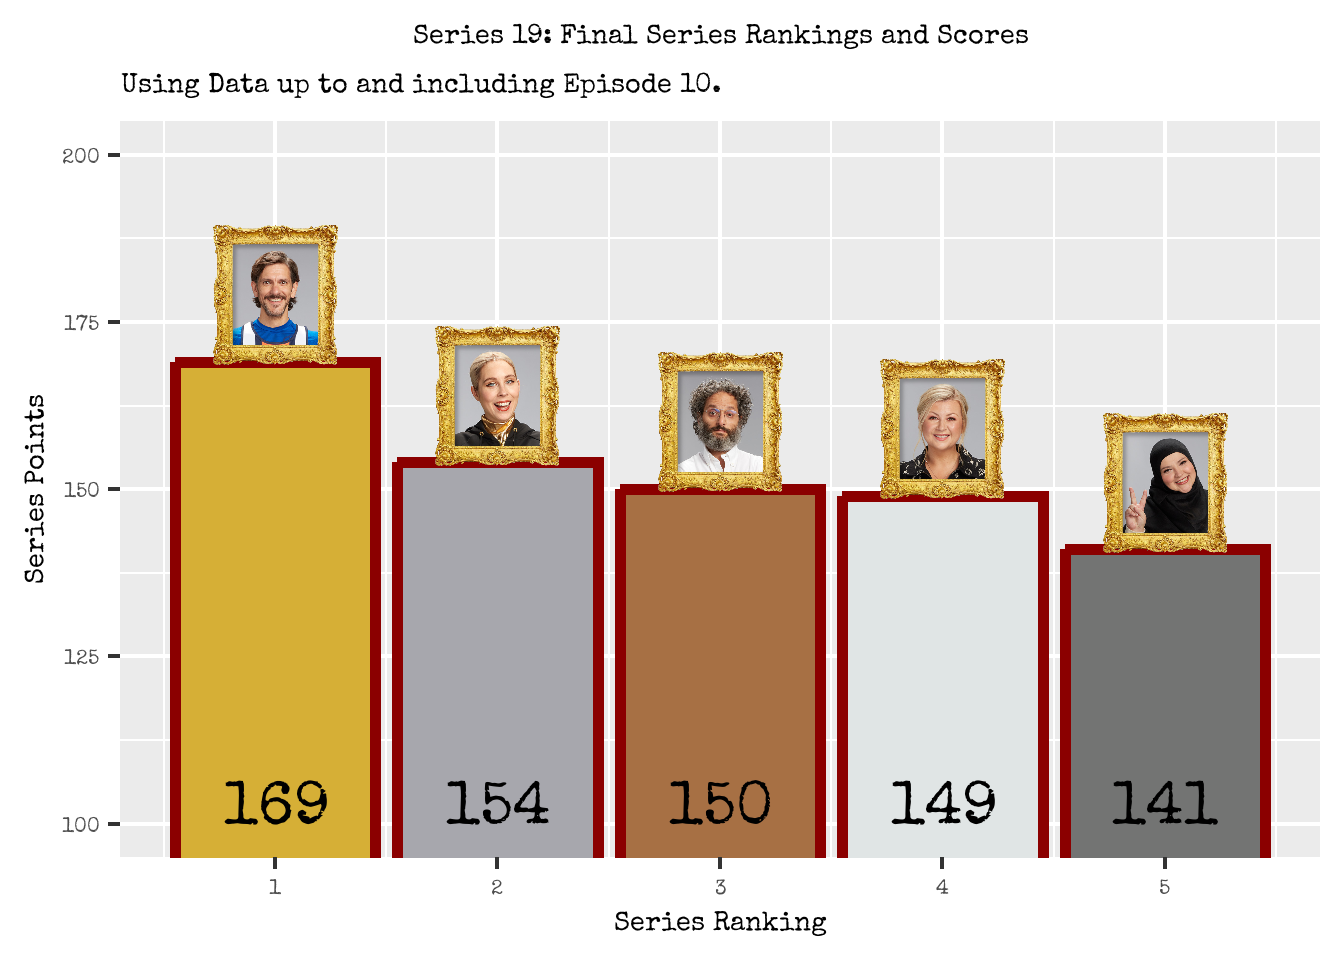
After 10 episodes, we can finally crown our Series 19 champion; Figure 1 shows the final scores and standings for each contestant.
Unsurprisingly, Mathew Baynton continued his winning streak through and ultimately won the series.
His personal dignity did however suffer but these are the sacrifices one must make to be crowned a champion of a series.
Figure 2: One of Mathew’s sacrifices he made along the way to championship.

It is all change for the remaining cast members as their series standings varied quite a bit compared to those at the end of episode 9:
- Fatiha dropped from 3rd place to 5th place.
- Jason ascended from 5th place to 3rd place.
- Rosie dropped from 2nd place to 4th place.
- Stevie ascended from 4th place to 2nd place.
Stevie and Jason both had strong Episode 10’s placing 1st and 2nd respectively, whilst Fatiha and Rosie had disastrous Episode 10’s placing 5th and 4th respectively.
Going into Episode 10, we were well aware that the race for 2nd, 3rd, 4th and 5th position was incredibly tight with only 5 points separating the contestant in these rankings. Such a change up in the final series rankings is not an entire surprise, but was still quite surprising in some respect.
By the end of the series, the points separation between 2nd to 5th position was 13 points, which potentially indicates how poorly Fatiha performed in this episode as the point range increased so much. Alternatively, Stevie could have performed extraordinarily well.
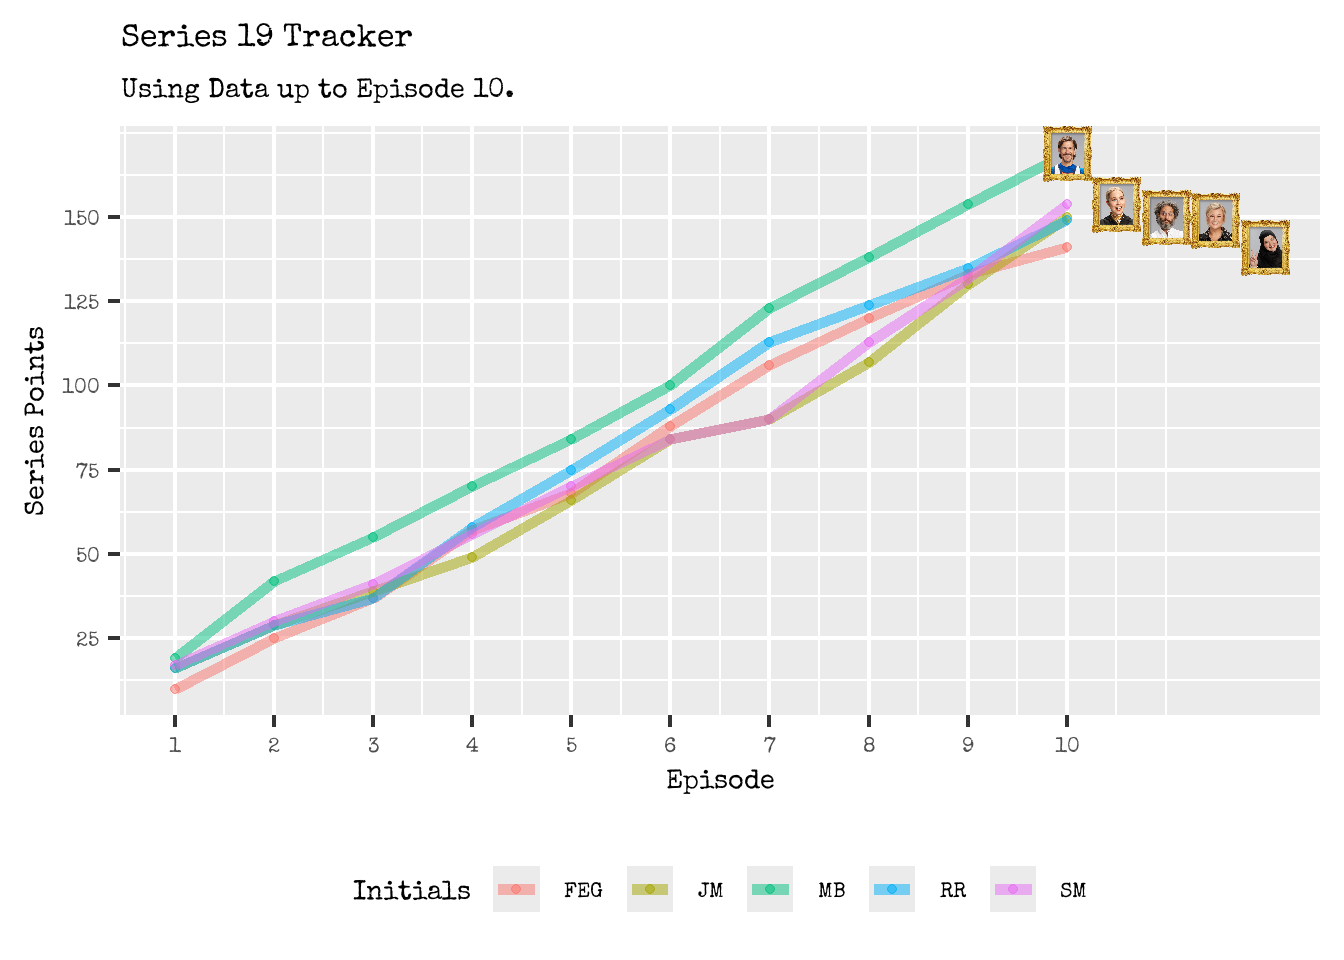
From the Series 19 tracker, it was clear from Episode 2 onwards that Mathew was the leader of this chaotic pack. Interesting, the outcome of Episode 1 would have been deemed sufficient in predicting the final series rankings accurately.
Wait, What Were the Predictions?
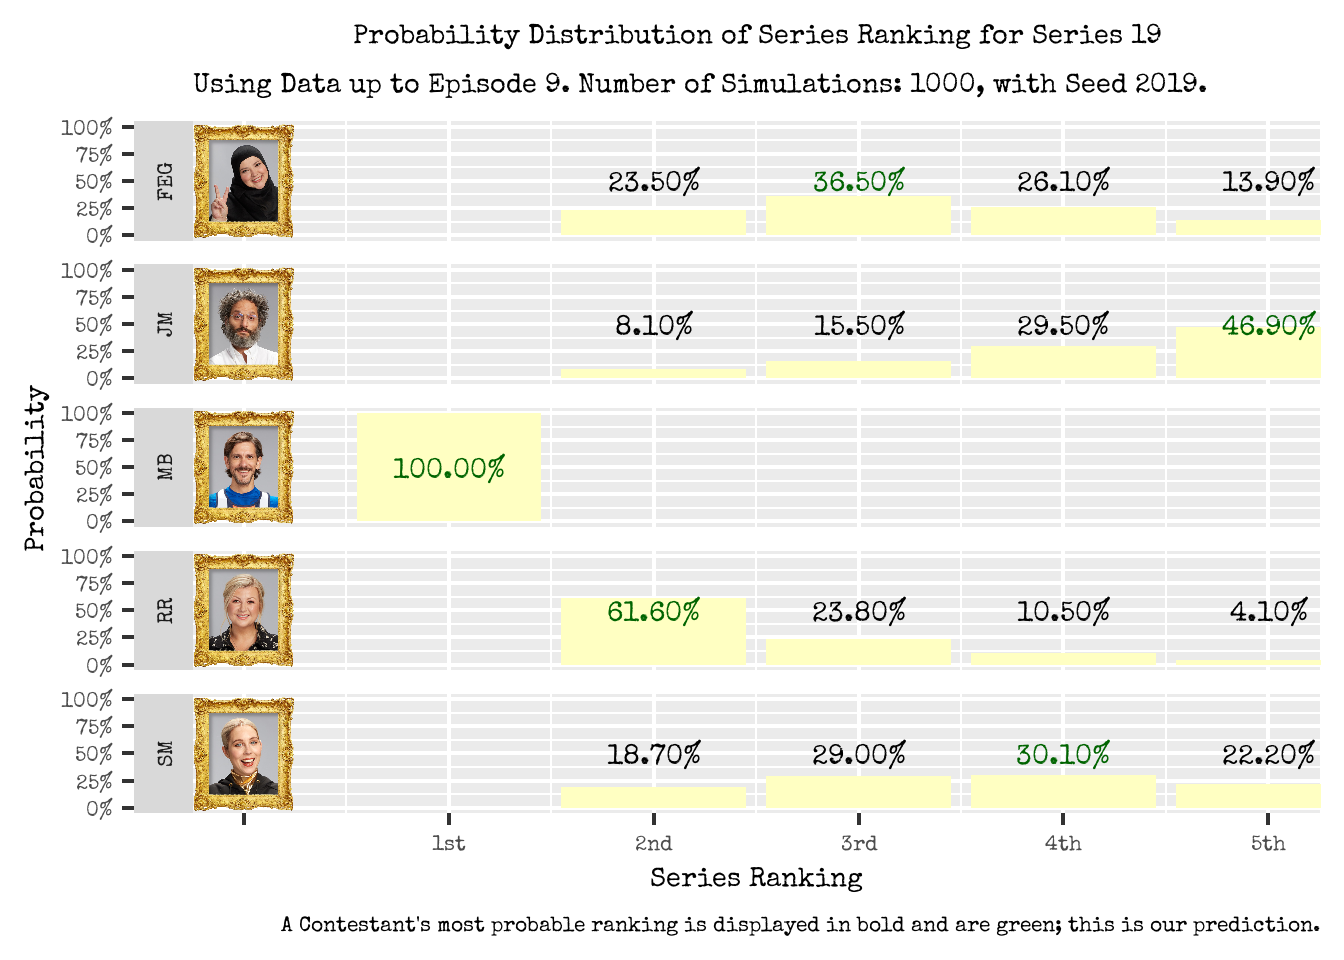
In a prior post, we generated distributions on a contestants ranking by the end of the series, using data up to and include Episode 9. These distributions are displayed in Figure 3.
From these distributions, we can also formulate predictions on contestants ranking by the end of the series. For example, we can use the most probable ranking in each contestant’s distribution as our prediction for their series ranking.2
Based on this Most Probable Ranking logic, our predictions are as follows (displayed in green and bold font in Figure 3): :
- Fatiha: 3rd
- Jason: 5th
- Mathew: 1st
- Jason: 2nd
- Stevie: 4th
Figure 3: Probability Distribution of a Contestant’s Series Ranking. Our prediction for a contestant’s series ranking is the the most probable ranking for each contestant; these are in bold and are green
So we have predictions on the each contestant’s series ranking and we have the actual series rankings for them. The next big question is how do they compare to each other?
Go Compare.com
Comparisons between our predictions and the actual outcome as presented in Table 4. In addition, we also present the probability of the actual series ranking occurring in our distributions; this gives us a some sense of whether our probability distribution method deemed the actual outcome plausible.
Figure 4: Series 19 Comparison Table between Predictions and Actuals.
- We were spot on with our prediction with Mathew winning the series.
- Based on our distribution and the mechanics of Taskmaster, this is to be expected (Mathew had a 20+ lead at the end of episode 9).
- Never put it past mischievous Little Alex Horne to introduce some unexpected game mechanic however which could have altered the entire series rankings.
- We showed too little faith in Stevie and Jason as they outperformed compared to our prediction.
- Stevie finished in 2nd place when we predicted for her to finish in 4th.
- Jason finished in 3rd place when we expected him to come in last (5th).
- We showed too much faith in Rosie and Fatiha as they underperformed compared to our prediction.
- Rosie came in 4th when we predicted her to finish 2nd.
- Fatiha came in 5th when we predicted her to be in 3rd.
- For each contestant except for Mathew, the probability of the actual ranking occurring in our probability distribution ranged between 10.50% (Rosie) and 18.70% (Stevie).
- This means the observed ranking would occurred between 105 and 187 times in the 1000 timelines we simulated.
- The observed outcomes could have be occurred in our distributions and simulations, but they just weren’t considered to be the most likely to occur and thus a sensible probable prediction.
Figure 5: Jason Mantzoukas destroying all our expectations and predictions.

Scores on the Doors
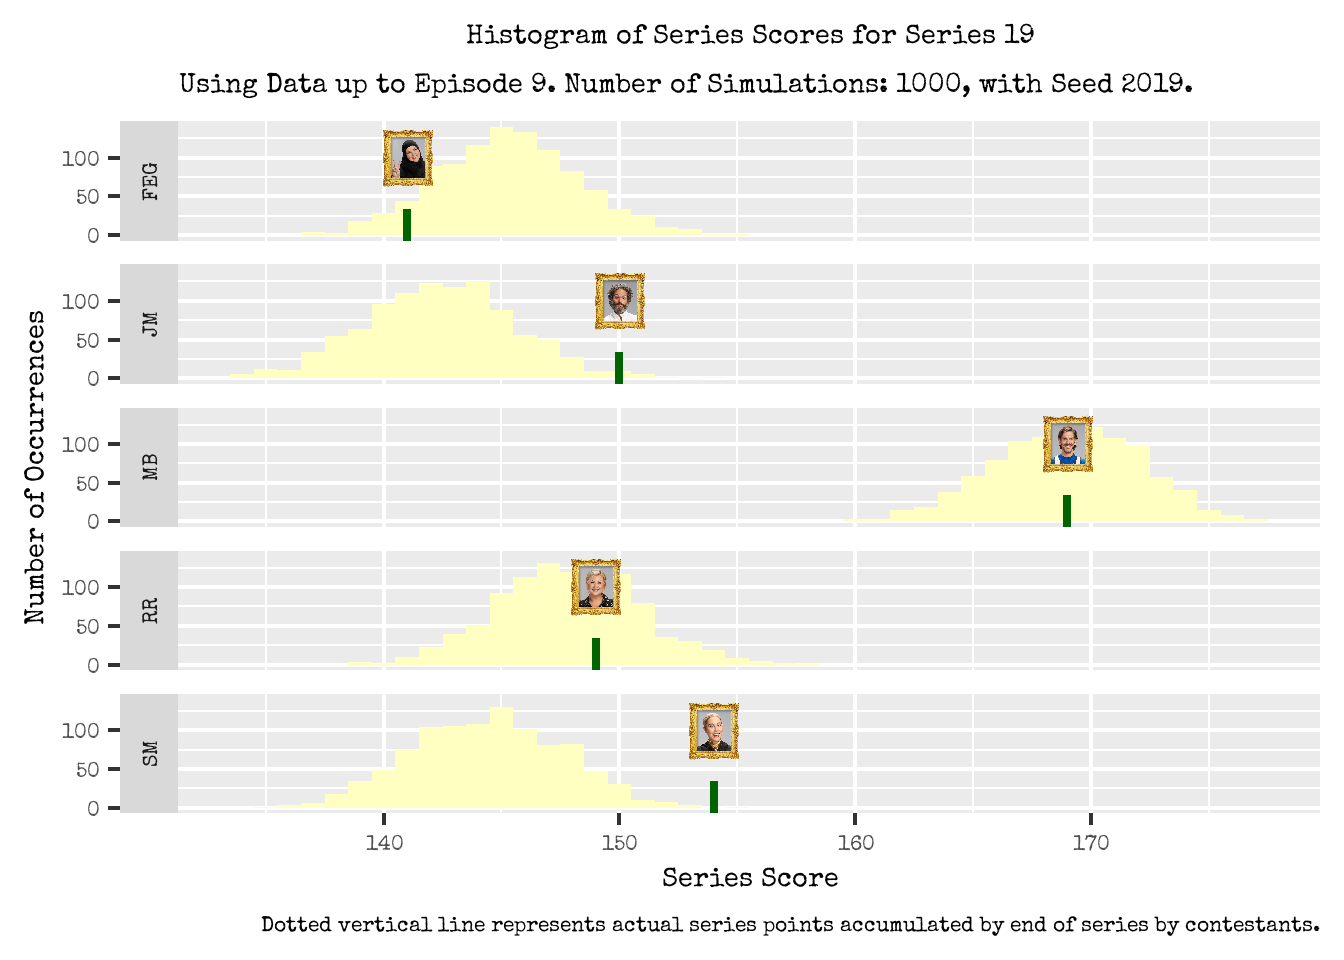
We’ve compared our series ranking predictions, but what about the series scores? Where do the observed series scores fall in the predicted distributions of series scores we generated?
These are explored in Figure 6 where we display the histograms of each contestants predicted series scores. The actual series score is denoted by the vertical line and contestant thumbnail.
Figure 6: Where do the final Series Scores lie in the Series Score Distributions for each contestant? Dotted vertical line represents actual series points accumulated by end of series by contestants.
Overall:
- Mathew and Rosie’s series scores are in line with our expectations; their series scores are not too far off from the center of their points distributions.
- Stevie and Jason outperformed our expectations; their series scores are on the right tail of their distributions.
- Fatiha underperformed based on our expectations; her series score is on the left tail of the distribution.
In particular:
- For Mathew and Rosie, their observed final series score is not too far off from the center of the histograms.
- This suggests that their performance in Episode 10 was as expected and comparable to previous tasks and episodes.
- Mathew scored 15 points in episode 10; prior to this his median and average episode score was 16 and 17.11 respectively.
- Rosie scored 14 points in episode 10; prior to this her median and average episode score was 16 and 15 respectively.
- For Stevie and Jason, their observed final series score is in the right tail of the histogram.
- This suggests that their strong performance was not anticipated with high probability based on past episodes.
- For Stevie, she scored 22 points in this episode; her median and average episode score has been 14 and 14.67 respectively up to episode 9. The maximum episode points Stevie received prior to this was 23.
- Jason scored 20 points in episode 10; his median and average episode score has been 16 and 14.44 respectively up to episode 9. The maximum episode points Jason had received prior to this was 23.
- Similarly on the opposite side for Fatiha, her final series score is in the left tail of the series score histogram.
- Her weak performance was not anticipated with substantially high probability based on past episodes.
- In fact, Episode 10 was the worst episode for Fatiha and she achieved her lowest episode score to date of 8 points. The lowest episode score prior to this was 10, and her median and average episode score were 14 and 14.77 respectively.
Figure 7: Stevie Martin skipping her way into 2nd place for the series.

The Margins of Error
The contestant series ranking predictions we presented above are based on the marginal distributions of each contestants distribution. It does not take into consideration the placement of the other contestants. If we want to consider the rankings of all cast members collectively, and the likelihood of them occurring, the joint distribution needs to be considered.
For example, in the timelines in which Fatiha was placed 2nd overall, it encompasses the 3rd to 5th position being filled by any of the contestants (Jason, Rosie and Stevie) in any order3. In some of these timelines Jason could have placed 3rd, other times Stevie may have been placed in this position, and similarly for Rosie. Information of these contestant placements are not conveyed in Fatiha’s marginal distribution.
These marginal contestant distributions do have the benefit of being simple to convey, but could also be misleading and lead to counter intuitive predictions when considering the series rankings for the cast jointly. For example, two or more contestants being predicted the same ranking when there are no ties4, or cast predictions which are not continuous (for example, jumping from 1st to 3rd position with no ties being present).
If we want to ensure we have consistent cast ranking predictions, we must consider the joint distribution of series ranking for all cast members rather than the isolated marginal distributions for each individual contestant; Figure 8 shows a subsection of this joint distribution for the full cast rankings of Series 19.
Figure 8: Joint Distribution of Series Rankings for the Entire Cast of Series 19
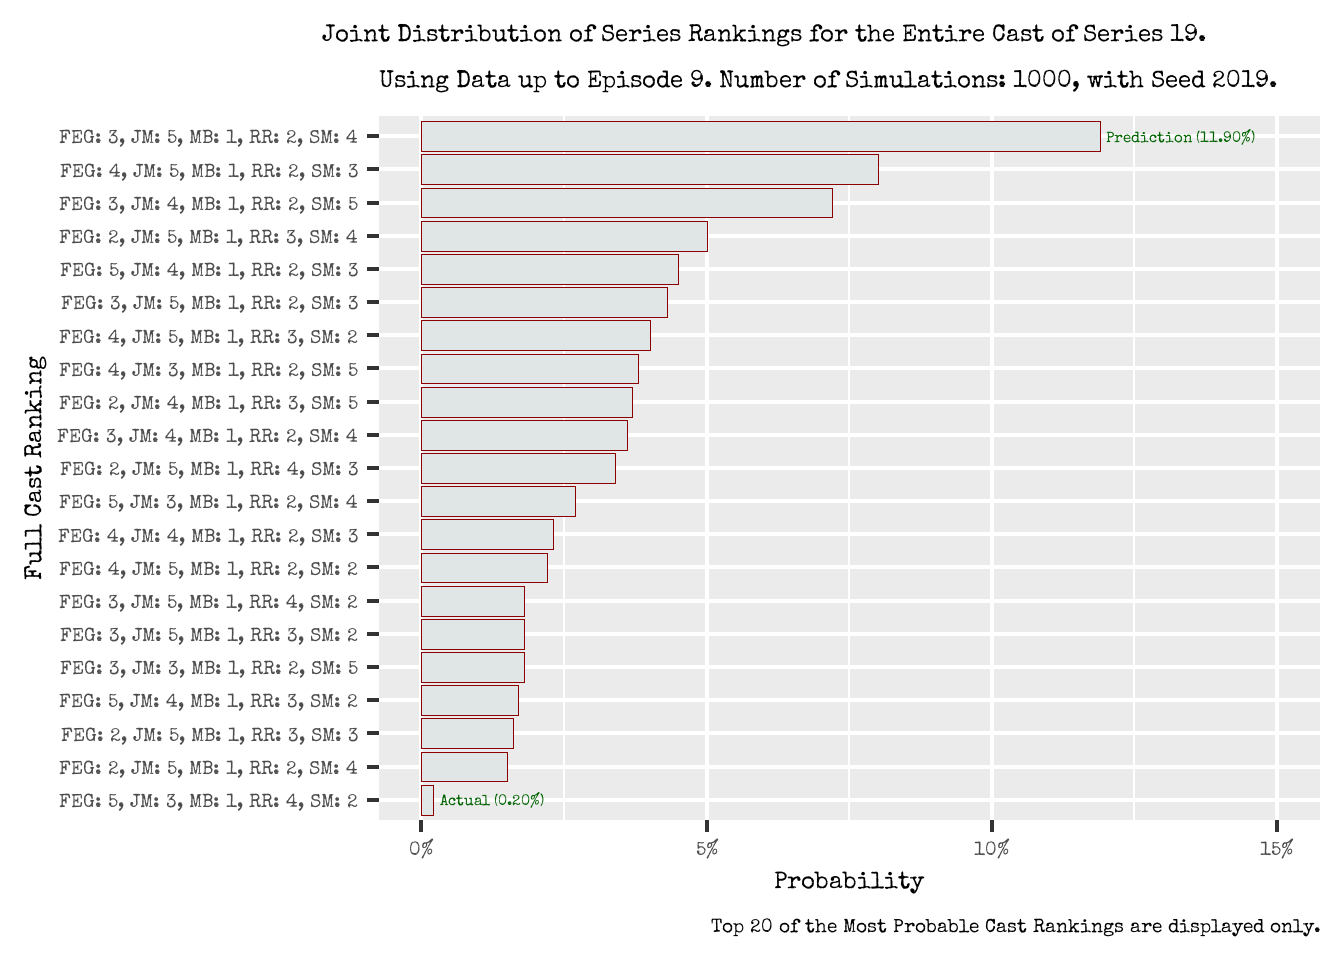
- The most probable series ranking combination is FEG: 3, JM: 5, MB: 1, RR: 2, SM: 4, with an estimated probability of 11.90%.
- This conveniently, and coincidentally, is the same as if we took the most probable series ranking from each contestant’s marginal distribution.
- Whilst this is a convenient finding (that the joint cast distribution prediction is the same as considering each contestant’s marginal distribution), this is not always true and does not always occur.
- For the observed full cast ranking combination FEG: 5, JM: 3, MB: 1, RR: 4, SM: 2, this has an estimated probability of 0.20% occurring.
- This means that this particular cast ranking combination was only observed in 2 timelines in the 1000 timelines we simulated.
- It is entirely plausible that this cast ranking combination was a rare occurrence. However, it is also possible (and more plausible) that 1000 simulations is potentially insufficient in estimating joint distributions of so many dimensions5. Increasing the number of simulations is still on the cards for a future task.
- By considering the joint distribution for the full cast ranking combinations, we also see alternative ranking combinations that could have occurred and how likely they may have occurred.
- These alternative cast rankings all occur with less than around 8% probability, which is noticeably less than the most probable cast ranking combination.
- They all feature Mathew Baynton (MB) in 1st place; this is not surprising given his marginal distribution had him placing 1st with 100%.
- For the other contestant, there is variability in their rankings which are in line with their marginal distributions.
Figure 9: A Joint Distribution considers….EVERYBODY!

The Prophet Nick Mohammed
In Episode 201, from around 56:30 mark of the Official Taskmaster Podcast, guest Nick Mohammed made the following prediction on the series outcome
In the final scores, there will be 6 ones and 1 six.
…
I think Stevie (Martin) is going to win.
…
I think Matt (Baynton) might crumble eventually, I think Matt’s doing very well but I think actually he’s going to slowly have a nervous breakdown.
- Nick was scarily on point with his point prediction; the final scores were (169, 154, 150, 149, 151) which does indeed have 6 ones and 1 six.
- Nick however was wrong in his prediction that Stevie would win, and that Matt would crumble eventually.
- If only he expressed his predictions in a probability distribution so that he could capture other outcomes and how sure or unsure he was of them.
- On the surface, Matt didn’t have a nervous breakdown and not become the series champion as a result. But who knows what lies beneath the Baynton surface, he’s been through a lot this series…

What Have We Learnt Today?
We’ve learnt that:
- Our series ranking predictions were correct for identifying the champion (Mathew Baynton), but incorrect for all other contestants.
- We should have had more faith in Stevie Martin and Jason Mantzoukas …
- … and less faith in Rosie Ramsey and Fatiha El-Ghorri.
- From our series score histogram:
- Mathew and Rosie performed as expected in episode 10 and their final series positions.
- Stevie and Jason had particularly strong episode 10’s.
- Fatiha had a weak episode 10 and achieved her worst score in the series.
- Even thought we did not get our predictions entirely correct, a predictive probability distribution allows us to consider all potential outcomes and how frequent (or infrequent) they are likely to occur.
- The importance of joint distributions over marginal distributions when making predictions, particularly if we want to ensure consistency in our ranking predictions.
- 1000 simulations may not be sufficient in capturing all potential timelines and estimating probability distributions accurately, in particular for joint distributions of many dimensions.
- Nick Mohammed is a witch, or maybe a vampire, due to his on point points prediction; that’s a hard fact to Swallow.

I actually googled this to see if it is fewer or less as LAH has often made snide remarks about this. Turns out my original hunch of “fewer” was correct as the entity, episodes in this case, is countable. Here’s to hoping that I spend less time in the future trying to appease the Grammar Gods…should that be fewer though? Time is a countable entity in some respect…↩︎
Other predictions from the distribution could also be made including using the average ranking, the median ranking, or a particular percentile. The prediction logic we employ should be catered to the application and potential downstream effects associated with how our predictions are being used; for example if we get penalised more for being more optimistic than pessimistic in a contestant.↩︎
Mathew is excluded as Mathew was always simulated to end up in 1st place.↩︎
Technically, this could also feasibly be predicted under a joint distribution due to ties. But shhh…↩︎
I would estimate that a minimum of 12,000 simulations are potentially needed to estimate a joint distribution of this size. This is based on the number of cast ranking combinations there are based on the fact there are 5 contestants in a cast, each taking one ranking each (from 1st to 5th) in the simplest case where there are no ties, and seeing 100 occurrences on average across each cast combination.↩︎